Unlock a world of possibilities! Login now and discover the exclusive benefits awaiting you.
Announcements
April 13–15 - Dare to Unleash a New Professional You at Qlik Connect 2026: Register Now!
- Qlik Community
- :
- All Forums
- :
- QlikView App Dev
- :
- Pivot Table Highlight Max Column
Options
- Subscribe to RSS Feed
- Mark Topic as New
- Mark Topic as Read
- Float this Topic for Current User
- Bookmark
- Subscribe
- Mute
- Printer Friendly Page
Turn on suggestions
Auto-suggest helps you quickly narrow down your search results by suggesting possible matches as you type.
Showing results for
Contributor II
2018-01-22
06:10 PM
- Mark as New
- Bookmark
- Subscribe
- Mute
- Subscribe to RSS Feed
- Permalink
- Report Inappropriate Content
Pivot Table Highlight Max Column
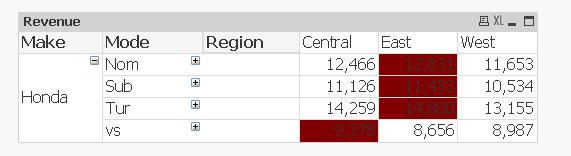
Hi I have some sample data that needs to be shown in a pivot table. Now I need to highlight the column (say background color) which has the highest revenue when the Mode column in collapsed. Like so
| Make | Mode | Region | Central | East | West |
| Honda | Nom | 12466 | 12831 | 11653 | |
| Sub | 11126 | 11433 | 10534 | ||
| Tur | 14259 | 14880 | 13155 | ||
| vs | 9278 | 8656 | 8987 |
So I far I have been trying with the Max, but not able to get it to work
Max ( aggr (NODISTINCT sum(Revenue) , Make, Mode, Region))
Attached qlikview document with inline data
Appreciate any help, Cheers
Sid
1,159 Views
1 Solution
Accepted Solutions
MVP
2018-01-22
10:30 PM
- Mark as New
- Bookmark
- Subscribe
- Mute
- Subscribe to RSS Feed
- Permalink
- Report Inappropriate Content
Try this
=If(Revenue = Max(TOTAL <Make, Mode>Aggr(Sum(Revenue), Make, Mode, Region)), Red())
2 Replies
MVP
2018-01-22
10:30 PM
- Mark as New
- Bookmark
- Subscribe
- Mute
- Subscribe to RSS Feed
- Permalink
- Report Inappropriate Content
Try this
=If(Revenue = Max(TOTAL <Make, Mode>Aggr(Sum(Revenue), Make, Mode, Region)), Red())
Contributor II
2018-01-23
12:18 AM
Author
- Mark as New
- Bookmark
- Subscribe
- Mute
- Subscribe to RSS Feed
- Permalink
- Report Inappropriate Content
Sweet, thanks for the quick reply
1,072 Views