Unlock a world of possibilities! Login now and discover the exclusive benefits awaiting you.
- Qlik Community
- :
- All Forums
- :
- QlikView App Dev
- :
- Re: Pivot Table - Layout Problem
- Subscribe to RSS Feed
- Mark Topic as New
- Mark Topic as Read
- Float this Topic for Current User
- Bookmark
- Subscribe
- Mute
- Printer Friendly Page
- Mark as New
- Bookmark
- Subscribe
- Mute
- Subscribe to RSS Feed
- Permalink
- Report Inappropriate Content
Pivot Table - Layout Problem
Most of my questions were resolved quickly by the search function.
This Time, i could not find an answer.
So here is my Problem: I want to compare Temparatures in identical buildings in the same area.
"Location" is simply a sensor in an "area"
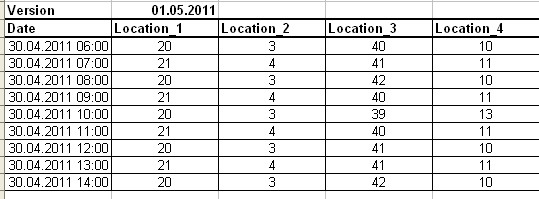
The Data is imported from excel files like this

to preven having attributes like Location_1, Location_2 etc. the Data is transformed (by using crosstable) to:

I have loaded the current tables for building A and B. (Date, Location, Temperature(A or B))
Now i want to display the data of building A and building B in a pivot table
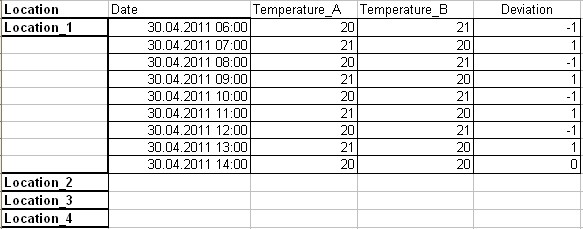
at the moment, it looks like this:

But it should look like this:

Im looking forward to your suggestions ![]()
Accepted Solutions
- Mark as New
- Bookmark
- Subscribe
- Mute
- Subscribe to RSS Feed
- Permalink
- Report Inappropriate Content
Hi,
Not sure , i have understood your problem. Have a look at the attached application.
- Sridhar
- Mark as New
- Bookmark
- Subscribe
- Mute
- Subscribe to RSS Feed
- Permalink
- Report Inappropriate Content
Hi .
U can shift the column from vertical view to horizontal view.
see the image below.
- Mark as New
- Bookmark
- Subscribe
- Mute
- Subscribe to RSS Feed
- Permalink
- Report Inappropriate Content
Hi,
You need to click and drag the field Location field and drag it to top right untill a blue horizontal arrow not comes and then just release that field there then you see your location field pivoted according to columns.
Try it hope this helps you.
Regards,
Anand
- Mark as New
- Bookmark
- Subscribe
- Mute
- Subscribe to RSS Feed
- Permalink
- Report Inappropriate Content
I tried both before, but i cant move them that way i want them to.
Unless i LOAD EVERY Sensor in its own Attribute (Location_1, Location_1B, Location_2), i cant get the view i want.
- Mark as New
- Bookmark
- Subscribe
- Mute
- Subscribe to RSS Feed
- Permalink
- Report Inappropriate Content
Hi,
Do you have any sample file in this case it will going more easy for you. If you provide i explain to you on that.
Regards,
Anand
- Mark as New
- Bookmark
- Subscribe
- Mute
- Subscribe to RSS Feed
- Permalink
- Report Inappropriate Content
Thanks alot Anand (and everyone else)
The tables for building A and B are in the tables "Build_A" and "Build_B"
- Mark as New
- Bookmark
- Subscribe
- Mute
- Subscribe to RSS Feed
- Permalink
- Report Inappropriate Content
Hi,
Not sure , i have understood your problem. Have a look at the attached application.
- Sridhar