Unlock a world of possibilities! Login now and discover the exclusive benefits awaiting you.
- Qlik Community
- :
- All Forums
- :
- QlikView App Dev
- :
- Re: Pivot Table Partial Sum
- Subscribe to RSS Feed
- Mark Topic as New
- Mark Topic as Read
- Float this Topic for Current User
- Bookmark
- Subscribe
- Mute
- Printer Friendly Page
- Mark as New
- Bookmark
- Subscribe
- Mute
- Subscribe to RSS Feed
- Permalink
- Report Inappropriate Content
Pivot Table Partial Sum
Hi All,
I have pivot table with Expression :
% Visibility = sum([Target Visibility Acv])/Count([Customer Key])
% Target = avg([Target Outlet Pct])
Visibility Acv = if(isnull([% Visibility]), Null(), if([% Visibility]>=[% Target],1,0))
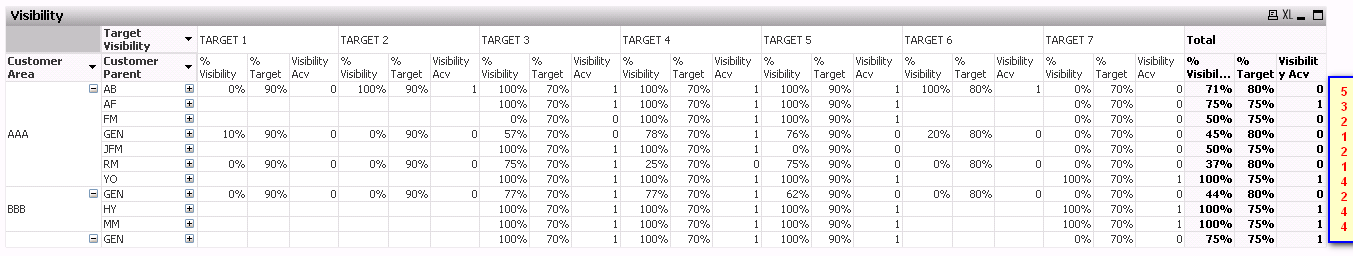
Please help so i can get Total Visibility Acv like box in blue (from sum of visibility acv).
I also attach the QVW file.
Really really appreciate if anyone could help me on this.
Thanks a lot
Accepted Solutions
- Mark as New
- Bookmark
- Subscribe
- Mute
- Subscribe to RSS Feed
- Permalink
- Report Inappropriate Content
Hi,
try this
If(SecondaryDimensionality() > 0,
if(isnull(sum([Target Visibility Acv])/Count([Customer Key])), Null(),
if(sum([Target Visibility Acv])/Count([Customer Key])>=[Target Outlet Pct],1,0)
),
RangeSum(First(
if(isnull(sum([Target Visibility Acv])/Count([Customer Key])), Null(),
if(sum([Target Visibility Acv])/Count([Customer Key])>=[Target Outlet Pct],1,0)),1,NoOfColumns())))
Regards,
Antonio
- Mark as New
- Bookmark
- Subscribe
- Mute
- Subscribe to RSS Feed
- Permalink
- Report Inappropriate Content
Some what i understand your intention but not fully. Here, One option may be Custom Format cell for that?
- Mark as New
- Bookmark
- Subscribe
- Mute
- Subscribe to RSS Feed
- Permalink
- Report Inappropriate Content
What was the logic behind the last column?????
Can you explain little bit more???
Regards,
Please appreciate our Qlik community members by giving Kudos for sharing their time for your query. If your query is answered, please mark the topic as resolved 🙂
- Mark as New
- Bookmark
- Subscribe
- Mute
- Subscribe to RSS Feed
- Permalink
- Report Inappropriate Content
If i understand correctly, there might be some issue with your Total Visibility Acv Expression, because of this issue it's not counting & sum all Visibility Acv values from Different Targets, Hence you're seeing wrong results in Total Visibility Acv.
(Your question is bit confusing: Currently your Total Visibility Acv values are like: 0s, 1s. You are expecting the results like the Yellow colored one, is it correct?)
- Mark as New
- Bookmark
- Subscribe
- Mute
- Subscribe to RSS Feed
- Permalink
- Report Inappropriate Content
Hi,
try this
If(SecondaryDimensionality() > 0,
if(isnull(sum([Target Visibility Acv])/Count([Customer Key])), Null(),
if(sum([Target Visibility Acv])/Count([Customer Key])>=[Target Outlet Pct],1,0)
),
RangeSum(First(
if(isnull(sum([Target Visibility Acv])/Count([Customer Key])), Null(),
if(sum([Target Visibility Acv])/Count([Customer Key])>=[Target Outlet Pct],1,0)),1,NoOfColumns())))
Regards,
Antonio
- Mark as New
- Bookmark
- Subscribe
- Mute
- Subscribe to RSS Feed
- Permalink
- Report Inappropriate Content
Thanks a lot Antonio. It works 