Unlock a world of possibilities! Login now and discover the exclusive benefits awaiting you.
- Qlik Community
- :
- All Forums
- :
- QlikView App Dev
- :
- Pivot Table question
Options
- Subscribe to RSS Feed
- Mark Topic as New
- Mark Topic as Read
- Float this Topic for Current User
- Bookmark
- Subscribe
- Mute
- Printer Friendly Page
Turn on suggestions
Auto-suggest helps you quickly narrow down your search results by suggesting possible matches as you type.
Showing results for
Creator
2017-12-08
08:38 AM
- Mark as New
- Bookmark
- Subscribe
- Mute
- Subscribe to RSS Feed
- Permalink
- Report Inappropriate Content
Pivot Table question
Hi,
My data set looks like this
| Customer | Sales Date |
|---|---|
| Cust1 | 02/12/2017 |
| Cust1 | 03/12/2017 |
| Cust2 | 03/14/2017 |
| Cust2 | 02/15/2017 |
| Cust3 | 05/12/2017 |
| Cust3 | 06/12/2017 |
What i need to find out is
the first sales date of each customer and and then find the count of customer in each month to which their first sales date belongs to.
for example:
The first sales date of Cust1 and Cust2 are 02/12 and 02/15 respectively.
So the chart should say something like this.
Similarly the first sales date of Cust3 is 05/12 so May will have count of 1
| Month | Number of customer |
|---|---|
| Feb | 2 |
| May | 1 |
There is also a master calendar on Sales date available in the data model.
Thanks,
Jean
655 Views
1 Solution
Accepted Solutions
MVP
2017-12-08
08:48 AM
- Mark as New
- Bookmark
- Subscribe
- Mute
- Subscribe to RSS Feed
- Permalink
- Report Inappropriate Content
2 Replies
MVP
2017-12-08
08:46 AM
- Mark as New
- Bookmark
- Subscribe
- Mute
- Subscribe to RSS Feed
- Permalink
- Report Inappropriate Content
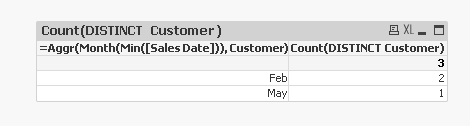
May be this
Dimension
Aggr(Month(Min([Sales Date])), Customer)
Expression
Count(DISTINCT Customer)
613 Views
MVP
2017-12-08
08:48 AM
- Mark as New
- Bookmark
- Subscribe
- Mute
- Subscribe to RSS Feed
- Permalink
- Report Inappropriate Content
Check attached