Unlock a world of possibilities! Login now and discover the exclusive benefits awaiting you.
- Qlik Community
- :
- All Forums
- :
- QlikView App Dev
- :
- Re: Pivot Table: sum of 1 dimension
- Subscribe to RSS Feed
- Mark Topic as New
- Mark Topic as Read
- Float this Topic for Current User
- Bookmark
- Subscribe
- Mute
- Printer Friendly Page
- Mark as New
- Bookmark
- Subscribe
- Mute
- Subscribe to RSS Feed
- Permalink
- Report Inappropriate Content
Pivot Table: sum of 1 dimension
Hello,
I'm trying to recreate a table that was previously used in Excel and I'm stuck...
Here's the straight table
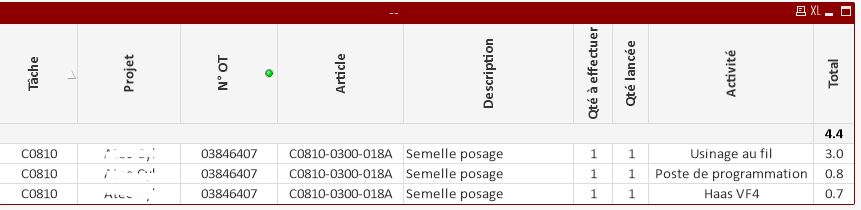
My dimension "Activité" has several operations that are used in the making of each "Article"
The expression is the total time (in hundredths) used for each activity
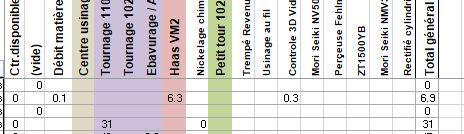
Here is the Pivot table:
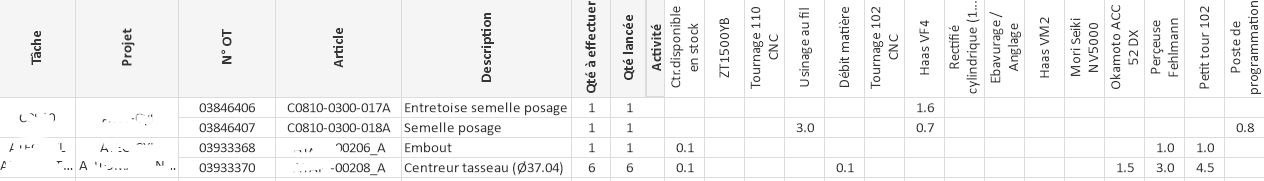
I'm unable to find how I could get a final column containing the SUM of the time for each Article like in my Excel file
I tried several ways (aggr function, ...) but I'm stuck
Any help is appreciated 
Thanks !
FG
- Mark as New
- Bookmark
- Subscribe
- Mute
- Subscribe to RSS Feed
- Permalink
- Report Inappropriate Content
Hi,
you will need to add more details here, try to attach sample data or sample app to take a look
- Mark as New
- Bookmark
- Subscribe
- Mute
- Subscribe to RSS Feed
- Permalink
- Report Inappropriate Content
Hi,
I'd like to be able to show the total for each rows, as per this mock-up example
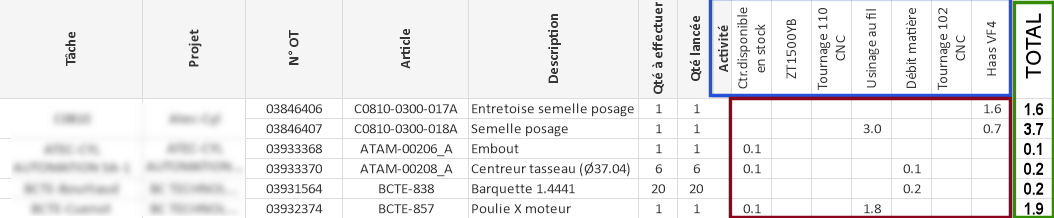
Dimension developed is "ACTIVITY" (in blue)
Expression is "TIME" (in red)
What I would like to achieve "TOTAL TIME" (adding all the time of each activities) (in green)
Thank you
- Mark as New
- Bookmark
- Subscribe
- Mute
- Subscribe to RSS Feed
- Permalink
- Report Inappropriate Content
Can you scramble the data if it is sensitive and attach a sample app?
I have to test it
- Mark as New
- Bookmark
- Subscribe
- Mute
- Subscribe to RSS Feed
- Permalink
- Report Inappropriate Content
Hi Fabien, if the expression is just Sum(TIME), checking the 'show partial sums option' for Activité dimension in presentation tab should work. Sometimes with vertical dimensions needs to save, close and open to refresh the chat and see the totals.
If the expression is more complicated the Aggr option will be like:
Sum(Aggr(CurrentExpression, Dim1, Dim2... DimN))
- Mark as New
- Bookmark
- Subscribe
- Mute
- Subscribe to RSS Feed
- Permalink
- Report Inappropriate Content
Here is a qvw file with some of the same data (Inline)
- Mark as New
- Bookmark
- Subscribe
- Mute
- Subscribe to RSS Feed
- Permalink
- Report Inappropriate Content
PFA
Is this what you need ?
- Mark as New
- Bookmark
- Subscribe
- Mute
- Subscribe to RSS Feed
- Permalink
- Report Inappropriate Content
yes thats it!
i feel stupid now. i was sure that i tried 'show partial sums' before!!!???
thank you a lot
- Mark as New
- Bookmark
- Subscribe
- Mute
- Subscribe to RSS Feed
- Permalink
- Report Inappropriate Content
yes, thanks
as I said on Marin's post, i was sure that i tried it before....
thanks again
- Mark as New
- Bookmark
- Subscribe
- Mute
- Subscribe to RSS Feed
- Permalink
- Report Inappropriate Content
no problem, you're welcome.
don't forget to close the thread