Unlock a world of possibilities! Login now and discover the exclusive benefits awaiting you.
- Qlik Community
- :
- All Forums
- :
- QlikView App Dev
- :
- Re: Pivot Table to Chart
- Subscribe to RSS Feed
- Mark Topic as New
- Mark Topic as Read
- Float this Topic for Current User
- Bookmark
- Subscribe
- Mute
- Printer Friendly Page
- Mark as New
- Bookmark
- Subscribe
- Mute
- Subscribe to RSS Feed
- Permalink
- Report Inappropriate Content
Pivot Table to Chart
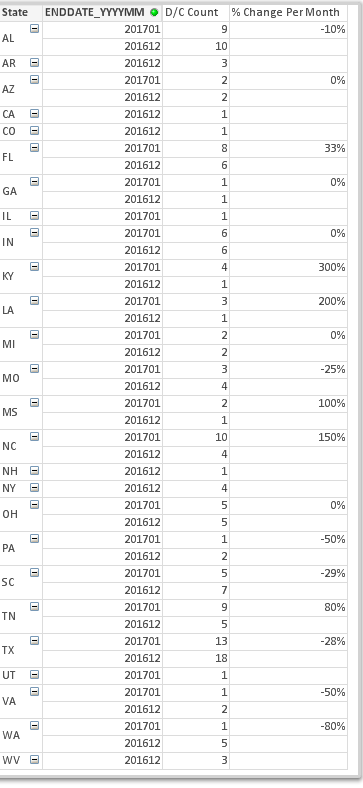
Is it possible to convert this Pivot table (See screenshot below) to a chart?
Dimensions:
State
EndDate_YYYYMM
Expressions:
Count({<[ENDDATE_YYYY] -= {"3000"}>}ID)
If(RowNo() <= 3, Num(Count({<[ENDDATE_YYYY] -= {"3000"}>}ID)/
Below(Count({<[ENDDATE_YYYY] -= {"3000"}>}ID), 1) - 1, '#.00%'))
- Mark as New
- Bookmark
- Subscribe
- Mute
- Subscribe to RSS Feed
- Permalink
- Report Inappropriate Content
Pivot table to a chart? Pivot table is also a chart... what exactly do you mean?
- Mark as New
- Bookmark
- Subscribe
- Mute
- Subscribe to RSS Feed
- Permalink
- Report Inappropriate Content
I would like to turn the pivot table into a bar chart but I have multiple dimensions (State and EndDate) and I'm not sure if that's possible.
- Mark as New
- Bookmark
- Subscribe
- Mute
- Subscribe to RSS Feed
- Permalink
- Report Inappropriate Content
May be this:
Aggr(
If(RowNo() <= 3, Num(Count({<[ENDDATE_YYYY] -= {"3000"}>}ID)/
Below(Count({<[ENDDATE_YYYY] -= {"3000"}>}ID), 1) - 1, '#.00%'))
, State, EndDate_YYYYMM)
- Mark as New
- Bookmark
- Subscribe
- Mute
- Subscribe to RSS Feed
- Permalink
- Report Inappropriate Content
Do you mean by 'Fast Change'?
Same chart but different views?