Unlock a world of possibilities! Login now and discover the exclusive benefits awaiting you.
- Qlik Community
- :
- All Forums
- :
- QlikView App Dev
- :
- Re: Pivot Table top 10
- Subscribe to RSS Feed
- Mark Topic as New
- Mark Topic as Read
- Float this Topic for Current User
- Bookmark
- Subscribe
- Mute
- Printer Friendly Page
- Mark as New
- Bookmark
- Subscribe
- Mute
- Subscribe to RSS Feed
- Permalink
- Report Inappropriate Content
Pivot Table top 10
Hi all,
I was just wondering if its possible to let a pivot table show me the top 10 best products I got.
Now I am using the following dimensions:
Productname:
Year
Month
Expression:
Revenue
Would using a variable solve my problem? Because when using a straight table you can use the dimension limits for a top10.
However I really like the benefits of the pivot table to show my values.
*Update
I would also like to add a slider attached to the table. So I could show top 10/15/20/25/30
kind regards.
- « Previous Replies
-
- 1
- 2
- Next Replies »
- Mark as New
- Bookmark
- Subscribe
- Mute
- Subscribe to RSS Feed
- Permalink
- Report Inappropriate Content
thank you so much!
last question I now got the top 10 is it possible to put last year performance of that typical shipmentlane next to this years.
top 5 revenue 2014 revenue 2013
-
-
-
-
-
- Mark as New
- Bookmark
- Subscribe
- Mute
- Subscribe to RSS Feed
- Permalink
- Report Inappropriate Content
You can, by using set analysis. Expression would be something like this: Sum({<Year={"$(=(Max(Year)-1))"}> }Revenue).
- Mark as New
- Bookmark
- Subscribe
- Mute
- Subscribe to RSS Feed
- Permalink
- Report Inappropriate Content
thanks
- Mark as New
- Bookmark
- Subscribe
- Mute
- Subscribe to RSS Feed
- Permalink
- Report Inappropriate Content
Good morning! friend
I am facing the same problem and I need your help
I try to display the first 10 sales per country in a Pivot table
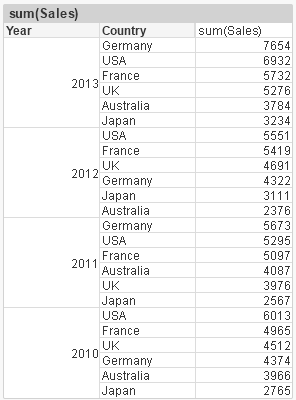
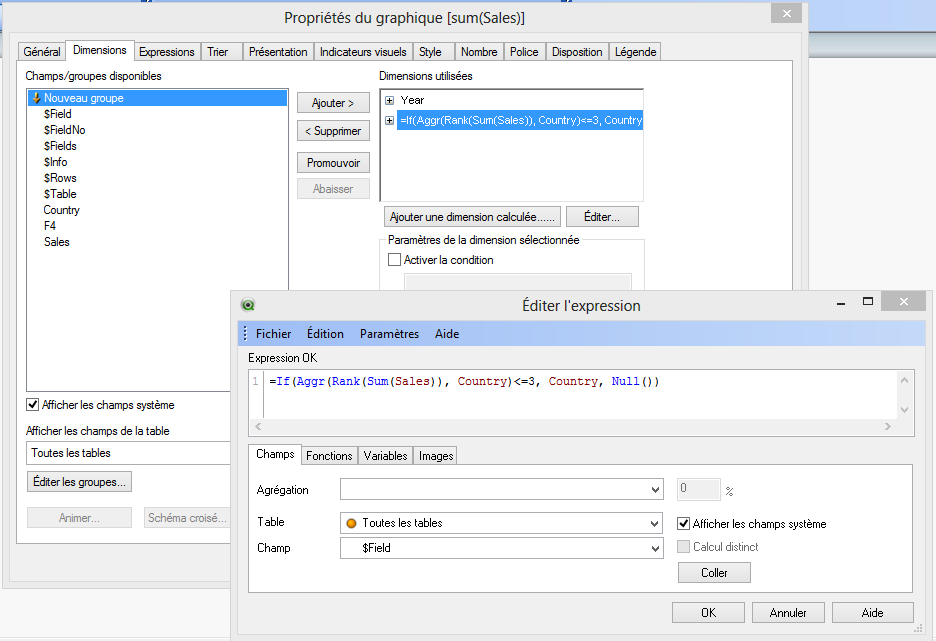
so I added this expression in dimensions

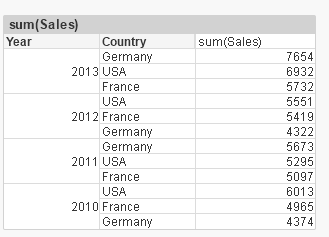
and as a result I have

as you can see for 2010 it gives a result USA-> France-> germany and the logical order is USA-> France-> UK
why?
Thank you for your answers
- Mark as New
- Bookmark
- Subscribe
- Mute
- Subscribe to RSS Feed
- Permalink
- Report Inappropriate Content
Good morning! friend
I am facing the same problem and I need your help
I try to display the first 10 sales per country in a Pivot table

so I added this expression in dimensions
and as a result I have
as you can see for 2010 it gives a result USA-> France-> germany and the logical order is USA-> France-> UK
why?
Thank you for your answers
- Mark as New
- Bookmark
- Subscribe
- Mute
- Subscribe to RSS Feed
- Permalink
- Report Inappropriate Content
change the <=3 to <=10
- « Previous Replies
-
- 1
- 2
- Next Replies »