Unlock a world of possibilities! Login now and discover the exclusive benefits awaiting you.
- Qlik Community
- :
- All Forums
- :
- QlikView App Dev
- :
- Re: Pivot table / Additional row.
- Subscribe to RSS Feed
- Mark Topic as New
- Mark Topic as Read
- Float this Topic for Current User
- Bookmark
- Subscribe
- Mute
- Printer Friendly Page
- Mark as New
- Bookmark
- Subscribe
- Mute
- Subscribe to RSS Feed
- Permalink
- Report Inappropriate Content
Pivot table / Additional row.
Hello all
I have the following PL data. I wanted to create a new CAT value called Gross Margin. But this value does not exist in the Excel document. How can I create this row in Qlikview without tampering with the Excel Document?
I want to use a pivot table to display my results.
- Tags:
- new_to_qlikview
- Mark as New
- Bookmark
- Subscribe
- Mute
- Subscribe to RSS Feed
- Permalink
- Report Inappropriate Content
You can go to the "Presentation" tab of your pivot table properties. From there Select your dimension (PL Item in this instance) and click 'Show Partial Sums'. This will give you a sum total of all the sales entries.
- Mark as New
- Bookmark
- Subscribe
- Mute
- Subscribe to RSS Feed
- Permalink
- Report Inappropriate Content
Hi Jacob
That I agree, but its very cosmetic. As you can see in the example below, if I only have Sales and COS, I get the correct Gross Margin value. However, if I include Heads, the Gross Margin value is incorrect.
Isn't there a way of creating the calculations and physically having a line called 'Gross Margin' rather than having it as a Total?
- Mark as New
- Bookmark
- Subscribe
- Mute
- Subscribe to RSS Feed
- Permalink
- Report Inappropriate Content
Hi Sabah,
Please check my demo qvw.
- Mark as New
- Bookmark
- Subscribe
- Mute
- Subscribe to RSS Feed
- Permalink
- Report Inappropriate Content
Hi Saumya,
Thanks for that reply.
Ok - so i'm working off from your idea, the first table I have tried to create the calculation for the Gross Margin, which is as follows:
if( CAT = 'COS', Sum({<CAT={'COS'}>} Sales),
if( CAT = 'Sales', Sum({<CAT={'Sales'}>} Sales),
if( CAT = 'Gross Margin', (Sum({<CAT={'Sales'}>} Sales) + Sum({<CAT={'COS'}>} Sales)),'')))
But, the value for Gross Margin still appears as zero.
Can you guide me?
- Mark as New
- Bookmark
- Subscribe
- Mute
- Subscribe to RSS Feed
- Permalink
- Report Inappropriate Content
If this is your final requirement ,you where going on wrong path
Check this qvw
- Mark as New
- Bookmark
- Subscribe
- Mute
- Subscribe to RSS Feed
- Permalink
- Report Inappropriate Content
Hey again,
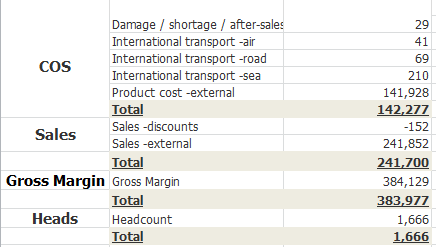
Again, this goes back to my previous query as you can see in the example below, if I only have Sales and COS, I get the correct Gross Margin value of 383977.
However, if I select 'Heads' for example, I don't want this to be a part of my Gross Margin total. Thats a seperate value.
In effect, I am looking for a result like this in Qlikview
