Unlock a world of possibilities! Login now and discover the exclusive benefits awaiting you.
- Qlik Community
- :
- All Forums
- :
- QlikView App Dev
- :
- Re: Pivot table aggregation issue.
- Subscribe to RSS Feed
- Mark Topic as New
- Mark Topic as Read
- Float this Topic for Current User
- Bookmark
- Subscribe
- Mute
- Printer Friendly Page
- Mark as New
- Bookmark
- Subscribe
- Mute
- Subscribe to RSS Feed
- Permalink
- Report Inappropriate Content
Pivot table aggregation issue.
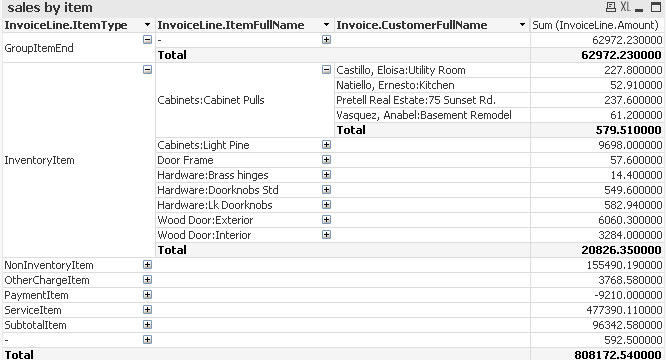
My report looks like this. it is pivot table chart..
The first 3 columns are dimensions and last column is sum(amount) expression.
I need to change the way 3rd column looks like.
The customer "Natiello Ernesto:Kitchen" has 3 invoices with item "Cabinets:Cabinet Pulls" but this report has aggregated the amount for all 3 invoices for this customer and shown as one row.
Is there any way I can show
Cabinets:Cabinet Pulls
Castillo, Eloisa:Utility Room 127.00
Castillo, Eloisa:Utility Room 100.80
Total 227.80
Natiello Ernesto:Kitchen 0
Natiello Ernesto:Kitchen 0
Natiello Ernesto:Kitchen 52.91
Total 52.91
- « Previous Replies
- Next Replies »
- Mark as New
- Bookmark
- Subscribe
- Mute
- Subscribe to RSS Feed
- Permalink
- Report Inappropriate Content
Hi Premhas,
Thanks for the qvw file. I have two questions though.
1. I saw that you have added " new_dimension". Does it mean we have to have one extra dimension between our expression and the original dimension (here it is CustomerFullname) to expand this original dimension to its maximum i.e. all occurrence of all customers?
we can not have the below mentioned layout without bringing an extra dimension between Customer name and sum(amount)
Cabinets:Cabinet Pulls
Castillo, Eloisa:Utility Room 127.00
Castillo, Eloisa:Utility Room 100.80
Total 227.80
Natiello Ernesto:Kitchen 0
Natiello Ernesto:Kitchen 0
Natiello Ernesto:Kitchen 52.91
Total 52.91
2. What is the difference between expression "sum(amount)" and "=sum(amount)".
- Mark as New
- Bookmark
- Subscribe
- Mute
- Subscribe to RSS Feed
- Permalink
- Report Inappropriate Content
for your first question answer : here whenever you write aggrigation expression in front end qlikview automatically aggrigate by the dimension by group( by)., so thats why i took another dimension rowno(), which gives unique identification number in the backend, so here we got another dimension ,here rowno() or new_dimension acting like invoice number or transaction time,. so thats why i added rowno() as new dimension ,and got the drill result.
for you second question answer : both are same
regards
Premhas
- Mark as New
- Bookmark
- Subscribe
- Mute
- Subscribe to RSS Feed
- Permalink
- Report Inappropriate Content
Hi Premhas,
Thanks for the answer!
I was just wondering if there is any aggregation function which can just return the text.
If that is possible then i can create a report like this
ItemType
ItemName
Invoice Number
100 Customer 1 80
101 Customer 2 70
Total 150
Invoice number is unique so I can use that as my last dimension and after i can use only expressions but for that I need to have an aggregation function which just returns text and aggregated values.
- « Previous Replies
- Next Replies »