Unlock a world of possibilities! Login now and discover the exclusive benefits awaiting you.
- Qlik Community
- :
- All Forums
- :
- QlikView App Dev
- :
- Pivot table
- Subscribe to RSS Feed
- Mark Topic as New
- Mark Topic as Read
- Float this Topic for Current User
- Bookmark
- Subscribe
- Mute
- Printer Friendly Page
- Mark as New
- Bookmark
- Subscribe
- Mute
- Subscribe to RSS Feed
- Permalink
- Report Inappropriate Content
Pivot table
Someone please help~~~ 
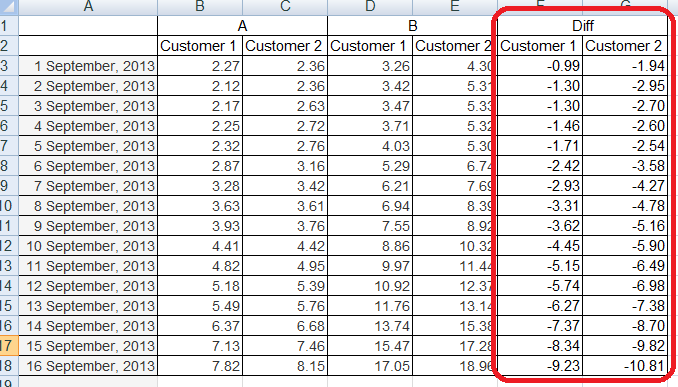
I have a pivot table which display the sales of customers for 2 different category of product (A and B).
Now I wants to add another column which display the Different between them (Just like the one in red box). What should I do??
Accepted Solutions
- Mark as New
- Bookmark
- Subscribe
- Mute
- Subscribe to RSS Feed
- Permalink
- Report Inappropriate Content
Hi Sharon,
If it is exactly 2 categories, then do the following
1. Add Date and Customer as Dimension in your Pivort Chart Object
2. Don't use Cateogry as Dimension, instead use it in expression as condition
3. Add first expression: Sum(If(Category='A',Sales))
4. Add secnod expression: Sum(If(Category='B',Sales))
5. Add third expression: Sum(If(category='A',Sales)) - Sum(If(Cateogry='B',Sales))
- Mark as New
- Bookmark
- Subscribe
- Mute
- Subscribe to RSS Feed
- Permalink
- Report Inappropriate Content
simply write
column(1)-Column(2)
- Mark as New
- Bookmark
- Subscribe
- Mute
- Subscribe to RSS Feed
- Permalink
- Report Inappropriate Content
Hi Sharon,
If it is exactly 2 categories, then do the following
1. Add Date and Customer as Dimension in your Pivort Chart Object
2. Don't use Cateogry as Dimension, instead use it in expression as condition
3. Add first expression: Sum(If(Category='A',Sales))
4. Add secnod expression: Sum(If(Category='B',Sales))
5. Add third expression: Sum(If(category='A',Sales)) - Sum(If(Cateogry='B',Sales))
- Mark as New
- Bookmark
- Subscribe
- Mute
- Subscribe to RSS Feed
- Permalink
- Report Inappropriate Content
If I do this. it will look like this:
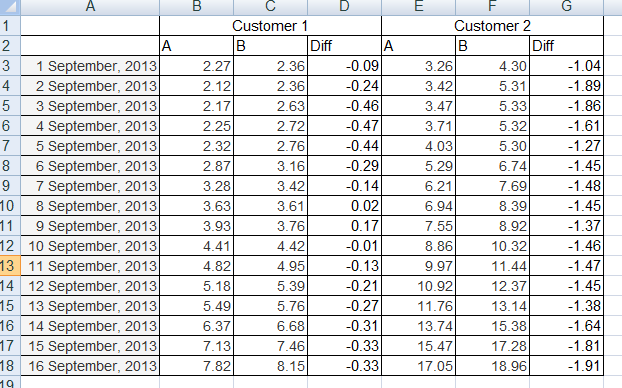
I don't think they will agree with this looks and feel..... so I must change the category Dimension in order to display the way the they wants....
I already updated my expression to handle the calculation. but I really dun know how to add the "Diff" in the dimension.....
- Mark as New
- Bookmark
- Subscribe
- Mute
- Subscribe to RSS Feed
- Permalink
- Report Inappropriate Content
Oh yes!!! you are correct... is the matter of pivoting~~~ thank you so much!!!!! 
- Mark as New
- Bookmark
- Subscribe
- Mute
- Subscribe to RSS Feed
- Permalink
- Report Inappropriate Content
No, you can drag and drop the Customer dimension below expression header. Qlikview pivot table will allow you to do that