Unlock a world of possibilities! Login now and discover the exclusive benefits awaiting you.
- Qlik Community
- :
- All Forums
- :
- QlikView App Dev
- :
- Re: Pivot table
- Subscribe to RSS Feed
- Mark Topic as New
- Mark Topic as Read
- Float this Topic for Current User
- Bookmark
- Subscribe
- Mute
- Printer Friendly Page
- Mark as New
- Bookmark
- Subscribe
- Mute
- Subscribe to RSS Feed
- Permalink
- Report Inappropriate Content
Pivot table
Hi all
I had created a pivot table
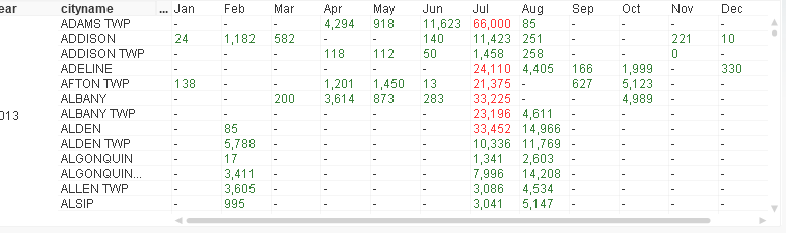
If i select the year 2012 it shows only the months which are having values for the particular year, which is correct, but i need all months to be shown in the pivot table even if the months don't have values.
Thanks
Accepted Solutions
- Mark as New
- Bookmark
- Subscribe
- Mute
- Subscribe to RSS Feed
- Permalink
- Report Inappropriate Content
- Mark as New
- Bookmark
- Subscribe
- Mute
- Subscribe to RSS Feed
- Permalink
- Report Inappropriate Content
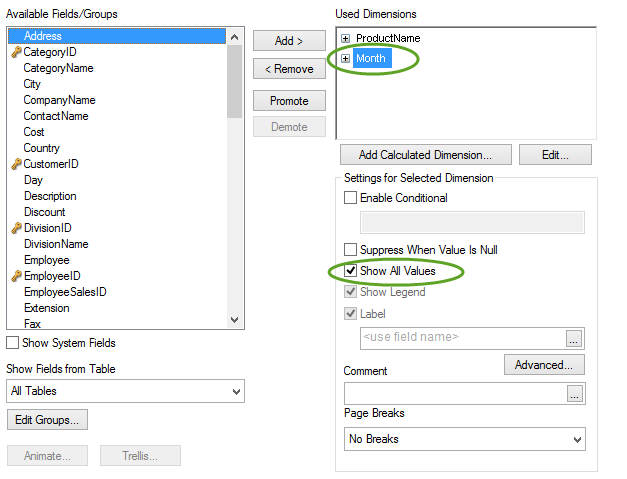
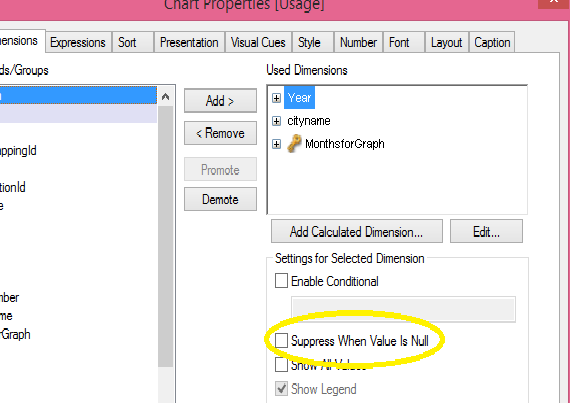
On the Dimension tab of properties select month and check "Show All Values".
On the Presentation tab, deselect "Supress Zero-Values" and "Supress Missing".
- Mark as New
- Bookmark
- Subscribe
- Mute
- Subscribe to RSS Feed
- Permalink
- Report Inappropriate Content
in presentation tab of pivot chart, you need to uncheck Suppress Zero-Values tick box.
- Mark as New
- Bookmark
- Subscribe
- Mute
- Subscribe to RSS Feed
- Permalink
- Report Inappropriate Content
Hello Johan,
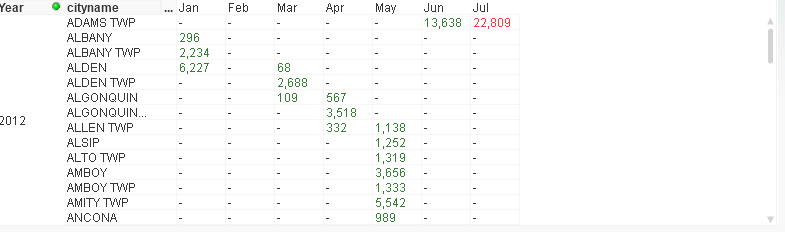
It didn't work. Since 2012 has values only for Jan to July, changing in Dimension tab and presentation tab didn't help. Any other trick.
Thanks for the quick reply.
- Mark as New
- Bookmark
- Subscribe
- Mute
- Subscribe to RSS Feed
- Permalink
- Report Inappropriate Content
Hi,
In dimensions, for month select "show all values"
Then in presentation tab, deselect "Suppress Zero-values", and then to make more evident the missing values, yo can change the "missing symbol" value: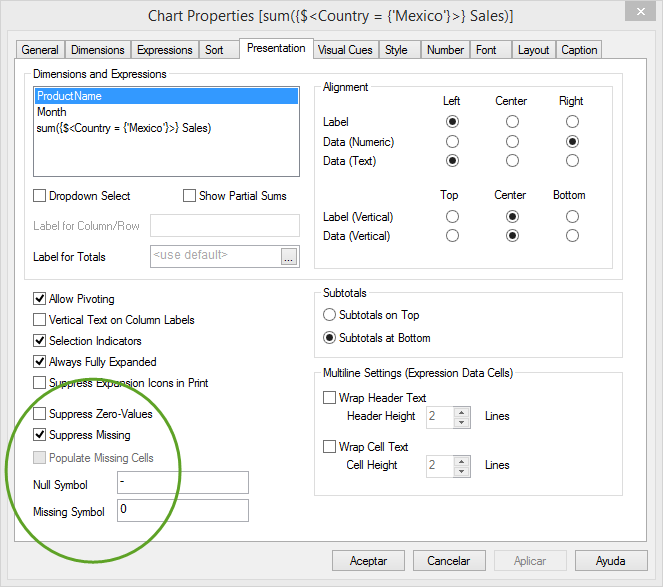
so you'll see the table with all the months, including, those where there are no values,
regards
- Mark as New
- Bookmark
- Subscribe
- Mute
- Subscribe to RSS Feed
- Permalink
- Report Inappropriate Content
Thanks for your response, i got the answer
- Mark as New
- Bookmark
- Subscribe
- Mute
- Subscribe to RSS Feed
- Permalink
- Report Inappropriate Content
Good day,
I have table as a below:
Capaicty | Premium |
5 | 2 |
10 | 4 |
8 | 6 |
7 | 8 |
12 | 5 |
4 | 7 |
5 | 9 |
9 | 11 |
8 | 13 |
15 | 15 |
12 | 17 |
I need to crate table in qlikview like this:
Capaicty | Premium |
1 - 5 | 18 |
6 - 10 | 42 |
11 - 30 | 37 |
In excel I can use sumif to create table. Here I could not create. Please, help me
Thanks in advance
- Mark as New
- Bookmark
- Subscribe
- Mute
- Subscribe to RSS Feed
- Permalink
- Report Inappropriate Content
Hi Orkhan,
Use the Class() function into the dimension. The class() function is used to create intervals:
CLASS(field, interval rank)
CLASS(Capacity, 5)
Regards.