Unlock a world of possibilities! Login now and discover the exclusive benefits awaiting you.
- Qlik Community
- :
- All Forums
- :
- QlikView App Dev
- :
- Pivot tables / Crosstables
- Subscribe to RSS Feed
- Mark Topic as New
- Mark Topic as Read
- Float this Topic for Current User
- Bookmark
- Subscribe
- Mute
- Printer Friendly Page
- Mark as New
- Bookmark
- Subscribe
- Mute
- Subscribe to RSS Feed
- Permalink
- Report Inappropriate Content
Pivot tables / Crosstables
Hi,
I am testing out Qlikview at the moment and I am trying to make some example reports to show to business users. I have loaded in some data from a sql statement from an Oracle database. As you can see I have just taken the PLSQL and dropped it in and this seems to be returning me a data set. In order to show this information I was wanting to produce some kind of pivot table. I am 3/4's of the way there however i have something strange happening, what i would like to create is something like this:
DFIELDNAME YEAR(DMONTH) MONTH(DYEAR) DFIELDVALUE
Principal Balance 2011 JAN 130,000,000,000.00
Principal Balance 2011 FEB 120,000,000,000.00
Principal Balance 2011 MAR 110,000,000,000.00
Principal Balance 2011 APR 100,000,000,000.00
Principal Balance 2011 MAY 99,000,000,000.00
Principal Balance 2011 JUN 88,000,000,000.00
Principal Balance 2011 JUL 66,000,000,000.00
What I actually have is very close except for some reason there are lots and lots of values against each month as shown in the image below:
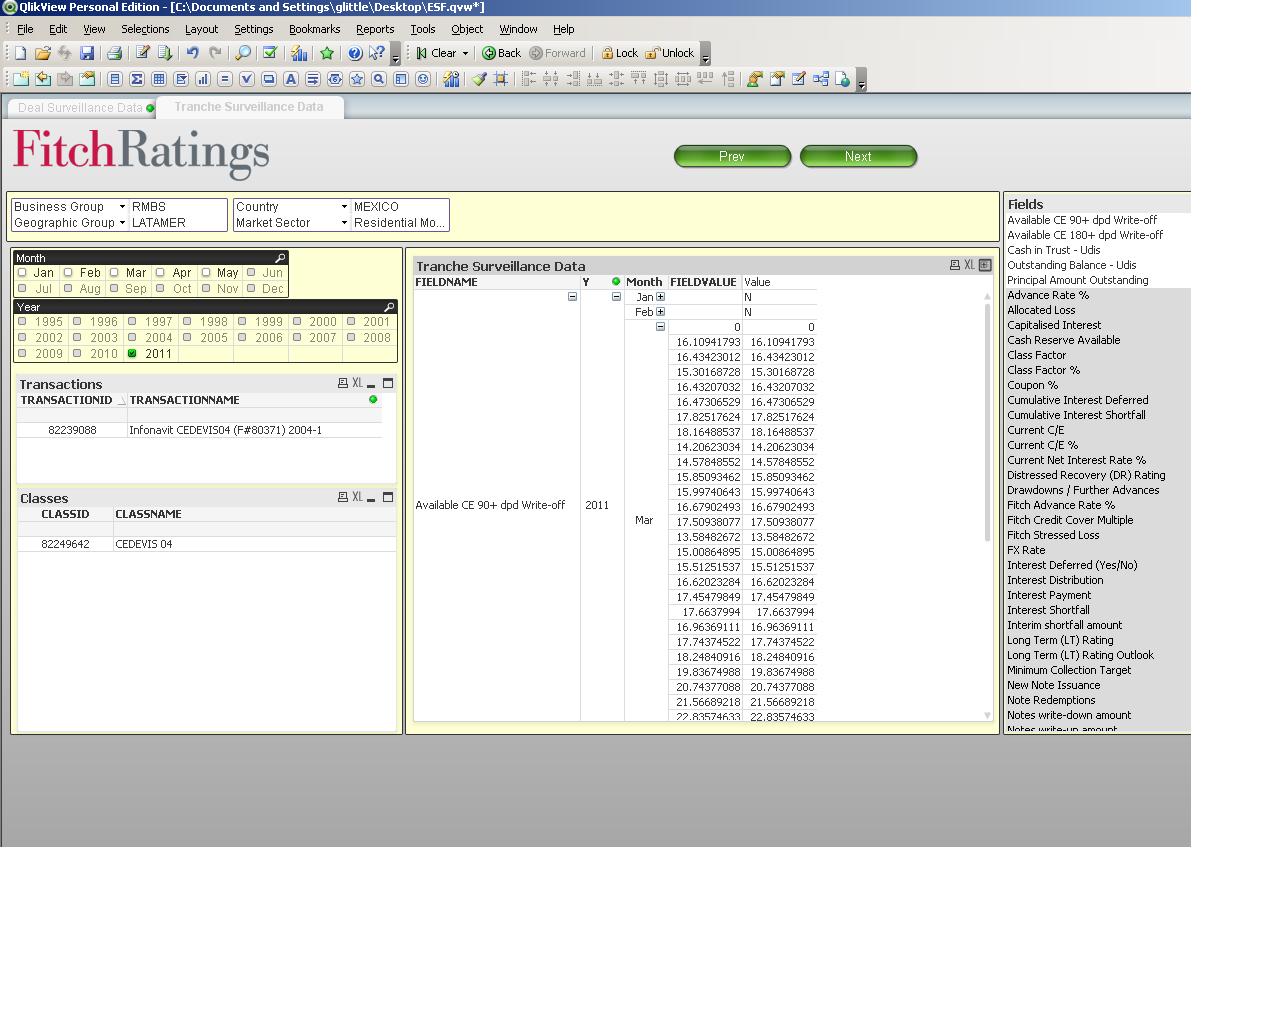
In my chart properties I have FIELDNAME / Year / Month / Fieldvalue as my Dimensions and in my expressions I have Value with a definition
of =FIELDVALUE.
Any help would be greatly appreciated and I appreciate I may not be using the system in the best so way so all suggestions are welcomed.
Many Thanks
Graham
SCRIPT
DealSurveillance:
select
d.deal_id DTRANSACTIONID,
fd.field_id DFIELDID,
d.deal_legal_name DTRANSACTIONNAME,
fd.label DFIELDNAME,
mp.period_id DPERIODID,
mp.period_date DFULLPERIODDATE,
trim(da.value_) DFIELDVALUE,
d.geo_segment DGEOSEGMENT,
d.CNTRY_NM DCOUNTRYOFASSETS,
d.business_group DBUSINESSGROUP,
d.mrkt_sctr_lvl_2 DMRKTSCTR
from
esf.report_deal d,
esf.data da,
esf.deal ed,
esf.model_field mf,
esf.model_period mp,
esf.field_defn fd
where ed.deal_id = da.object_id
and d.deal_id = ed.deal_id
and ed.model_id = mf.model_id
and ed.model_id = mp.model_id
and da.field_id = mf.field_id
and da.period_id = mp.period_id
and fd.field_id = mf.field_id
and fd.label not like 'P-%'
order by d.deal_legal_name, mf.sort_order, mp.period_date;
---
Temp1:
LOAD
min(DFULLPERIODDATE) as StartDate,
max(DFULLPERIODDATE) as EndDate
RESIDENT
DealSurveillance;
LET varMinDate = num(peek('StartDate', 0, 'Temp1'));
LET varMaxDate = num(peek('EndDate', 0, 'Temp1'));
DROP TABLE Temp1;
//Calculate number of days for calendar
LET TotalDays = (varMaxDate - varMinDate) + 1;
//Create a temporary calendar
TempCalendar:
LOAD
recno() AS DateKey,
date('$(varMinDate)' + recno() - 1, 'DD-MMM-YYYY') AS TempDate
autogenerate(TotalDays);
DCalendar:
LOAD
TempDate as DDate,
Day(TempDate) AS DDay,
Month(TempDate) AS DMonth,
MonthName(TempDate) AS DMonthYear,
'Q' & ceil(month(TempDate)/3) as DQuarter,
Year(TempDate) AS DYear
RESIDENT
TempCalendar;
DROP Table TempCalendar;
Accepted Solutions
- Mark as New
- Bookmark
- Subscribe
- Mute
- Subscribe to RSS Feed
- Permalink
- Report Inappropriate Content
In order to get this working I took a slightly different approach and rather than including the calendar based references as dimensions i have simply done a month and year function against the deal period date.
- Mark as New
- Bookmark
- Subscribe
- Mute
- Subscribe to RSS Feed
- Permalink
- Report Inappropriate Content
Try using Fieldname, Year and Month as Dimensions
and Sum(Fieldvalue) as Expression
- Mark as New
- Bookmark
- Subscribe
- Mute
- Subscribe to RSS Feed
- Permalink
- Report Inappropriate Content
I can't believe it but that seems to be the answer, values are now appearing in the value column. thank you very much for your help. Is there a list of the functions that are available in the script and the expected behaviour of them?
- Mark as New
- Bookmark
- Subscribe
- Mute
- Subscribe to RSS Feed
- Permalink
- Report Inappropriate Content
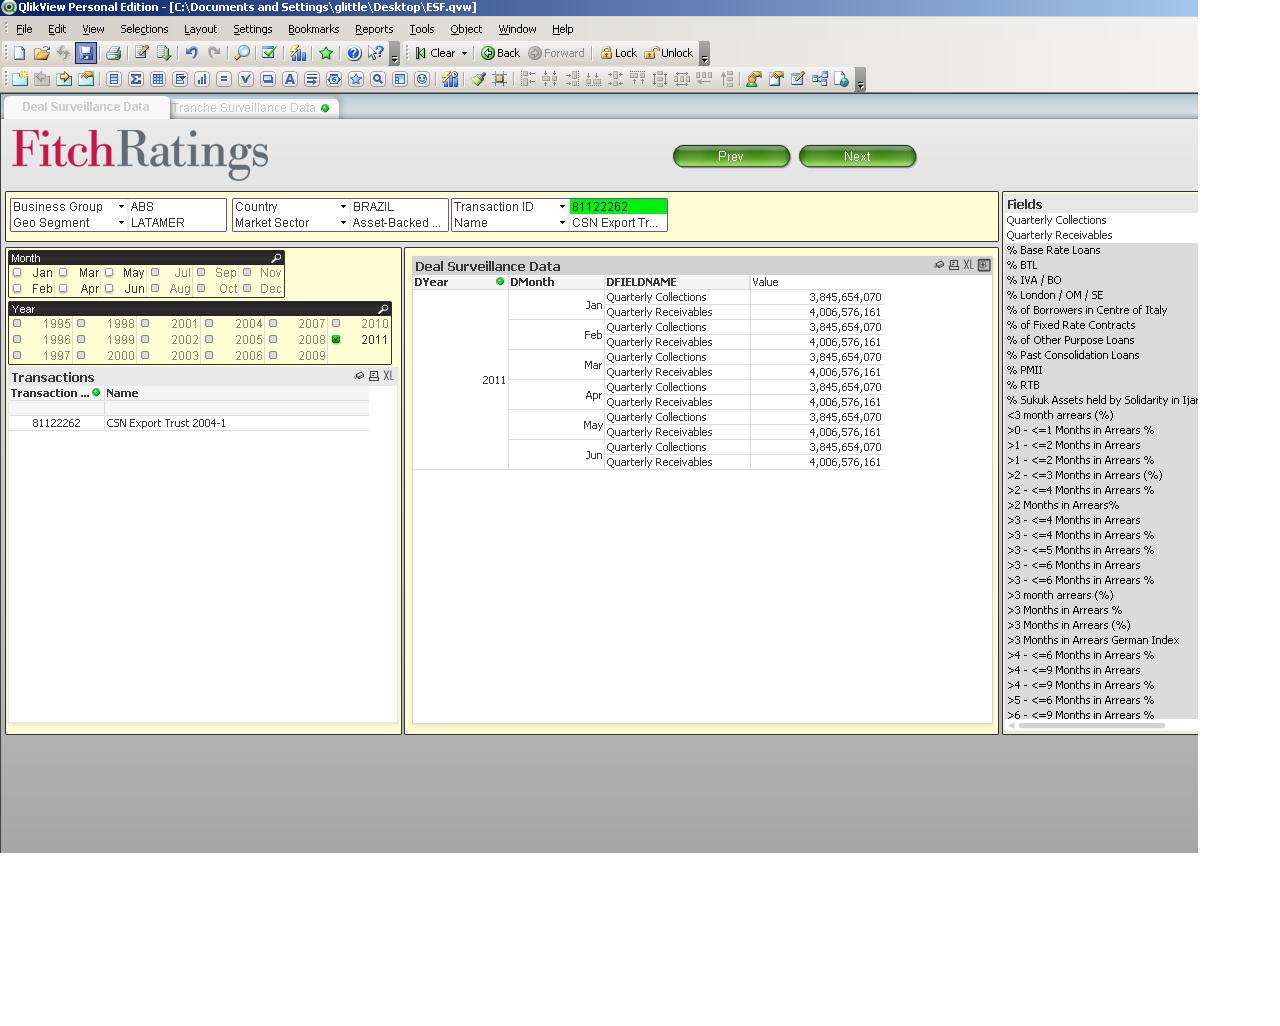
my bad, i double checked the figures and realised that what it is doing now gives the same value for each month as shown by the included image.
- Mark as New
- Bookmark
- Subscribe
- Mute
- Subscribe to RSS Feed
- Permalink
- Report Inappropriate Content
Yes. The details of script expressions are available in Book I of QlikView Reference Manual. The details of Chart expressions are in Book III.
- Mark as New
- Bookmark
- Subscribe
- Mute
- Subscribe to RSS Feed
- Permalink
- Report Inappropriate Content
Promote DFieldName above Year.
- Mark as New
- Bookmark
- Subscribe
- Mute
- Subscribe to RSS Feed
- Permalink
- Report Inappropriate Content
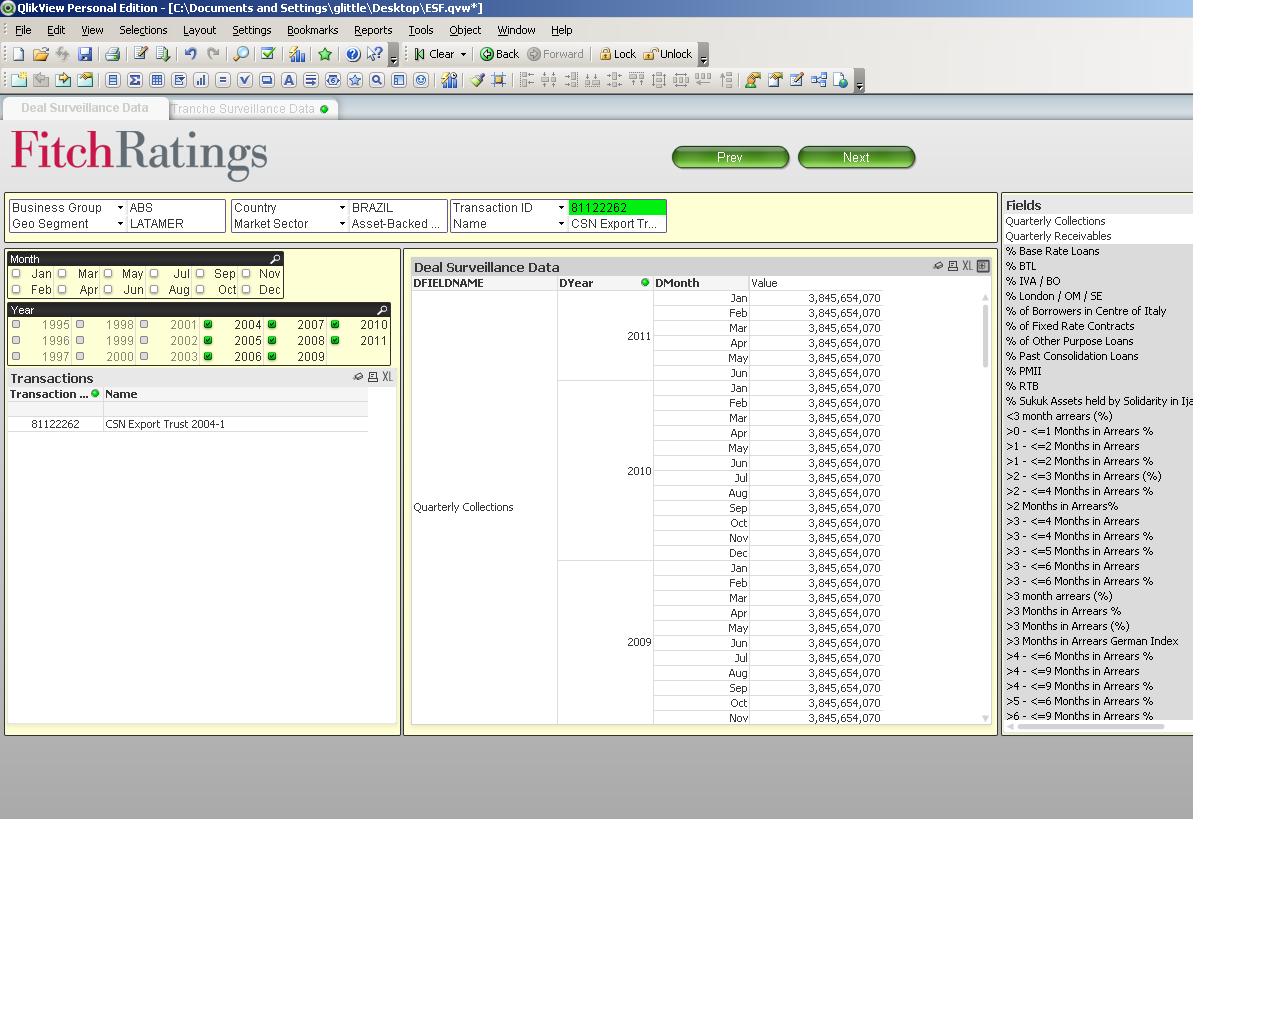
i tried that and the values are still the same for each month and year as shown below
- Mark as New
- Bookmark
- Subscribe
- Mute
- Subscribe to RSS Feed
- Permalink
- Report Inappropriate Content
In order to get this working I took a slightly different approach and rather than including the calendar based references as dimensions i have simply done a month and year function against the deal period date.