Unlock a world of possibilities! Login now and discover the exclusive benefits awaiting you.
- Qlik Community
- :
- All Forums
- :
- QlikView App Dev
- :
- Re: Plot Area color based on Y-Axis Values
Options
- Subscribe to RSS Feed
- Mark Topic as New
- Mark Topic as Read
- Float this Topic for Current User
- Bookmark
- Subscribe
- Mute
- Printer Friendly Page
Turn on suggestions
Auto-suggest helps you quickly narrow down your search results by suggesting possible matches as you type.
Showing results for
Anonymous
Not applicable
2017-09-18
01:22 PM
- Mark as New
- Bookmark
- Subscribe
- Mute
- Subscribe to RSS Feed
- Permalink
- Report Inappropriate Content
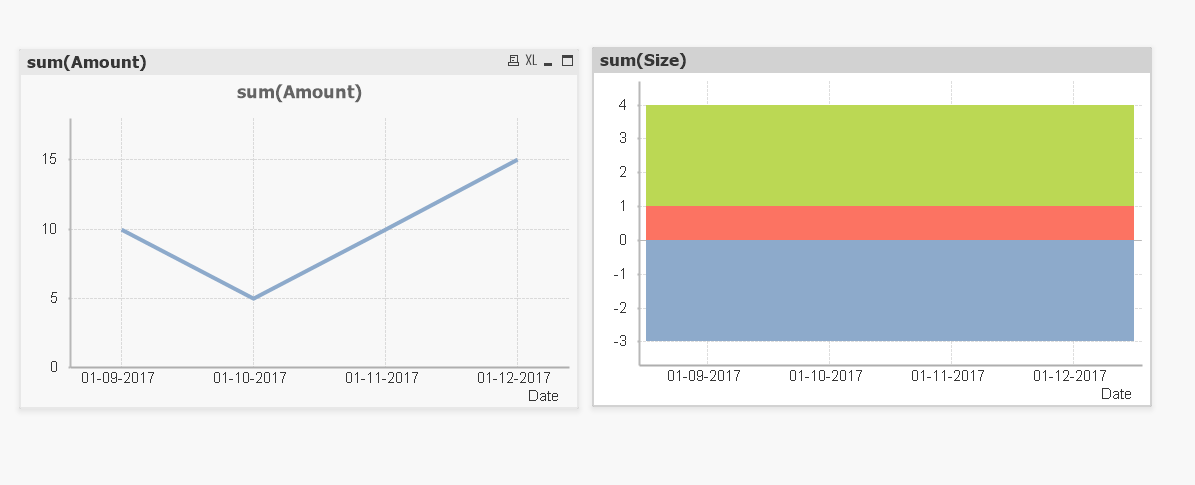
Plot Area color based on Y-Axis Values
Hello All,
Chart Type: Line Chart
Y-Axis Range : -3 to 3.
Now I want to show the plot area in Red color for the ranges -3 to -1,
Plot Area in Yellow Color -1 to 1
Plot Area in Green Color 1 to 3
All these should be static. PFA the sample one for this.
Can anyone help me please how to achieve this?
Thanks,
Nisha
834 Views
1 Reply
Specialist III
2017-09-18
02:32 PM
- Mark as New
- Bookmark
- Subscribe
- Mute
- Subscribe to RSS Feed
- Permalink
- Report Inappropriate Content
Hi,
The problem is that we can't make a combo with line graph and stacked bar. Only with line and bar graph.
But you can use a workaround with backgrounf transparency. See the atteched .qvw file.
Regards
701 Views