Unlock a world of possibilities! Login now and discover the exclusive benefits awaiting you.
- Qlik Community
- :
- All Forums
- :
- QlikView App Dev
- :
- Plotting Bell Curve
- Subscribe to RSS Feed
- Mark Topic as New
- Mark Topic as Read
- Float this Topic for Current User
- Bookmark
- Subscribe
- Mute
- Printer Friendly Page
- Mark as New
- Bookmark
- Subscribe
- Mute
- Subscribe to RSS Feed
- Permalink
- Report Inappropriate Content
Plotting Bell Curve
Hello all,
As i am new qlikview, please guide me in how to plot bell curve.
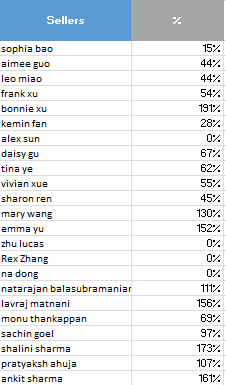
I have data in Excel like below
Sellers Goal(%)
a 20
b 340
c 120
d 34
e 120
f 176
g 15
h 340
i 20
j 20
Need to plot bell curve which shows the number of sellers that perform in certain % of goal .
Thanks in advance.
- Mark as New
- Bookmark
- Subscribe
- Mute
- Subscribe to RSS Feed
- Permalink
- Report Inappropriate Content
Tis question is similar to this one:
with the same problem, answered in part here:
- Mark as New
- Bookmark
- Subscribe
- Mute
- Subscribe to RSS Feed
- Permalink
- Report Inappropriate Content
See, For Bell curve you need good Data. See attachment
- Mark as New
- Bookmark
- Subscribe
- Mute
- Subscribe to RSS Feed
- Permalink
- Report Inappropriate Content
Thanks James and anil for your valuable reply.
I tried plotting graph using mentioned link. But unable to achieve it.It is displaying like below mentioned image.
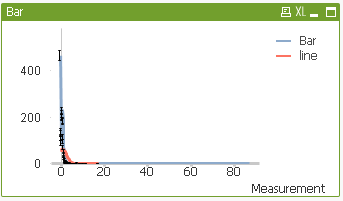
Please suggest me the steps to do bell curve.I have copied data sample .
Please advise.
Thanks in advance.