Unlock a world of possibilities! Login now and discover the exclusive benefits awaiting you.
- Qlik Community
- :
- All Forums
- :
- QlikView App Dev
- :
- Plotting scatter chart with lines and symbols
- Subscribe to RSS Feed
- Mark Topic as New
- Mark Topic as Read
- Float this Topic for Current User
- Bookmark
- Subscribe
- Mute
- Printer Friendly Page
- Mark as New
- Bookmark
- Subscribe
- Mute
- Subscribe to RSS Feed
- Permalink
- Report Inappropriate Content
Plotting scatter chart with lines and symbols
Hello guys,
I was to construct a Scatter Chart in QlikView based on data from an Excel file. The data, if plotted as a Scatter with Straight Lines chart will look like the following :
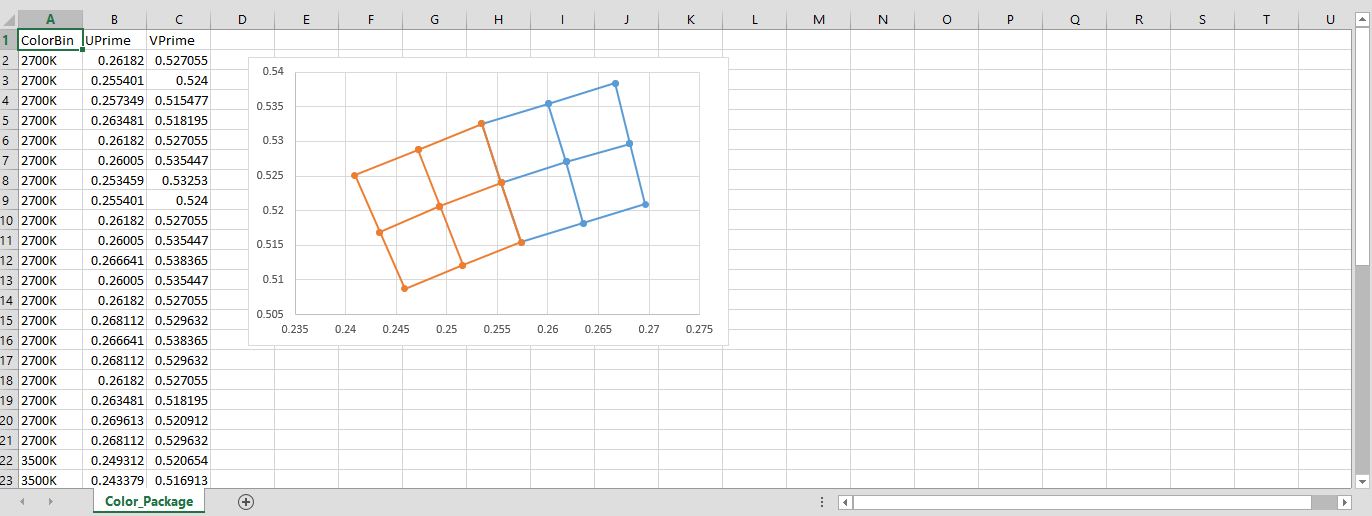
I used the same data from the Excel file and load it into QlikView; Add a new chart object. Set the ColorBin, UPrime and VPrime field as the Dimensions. But the following is what I got :
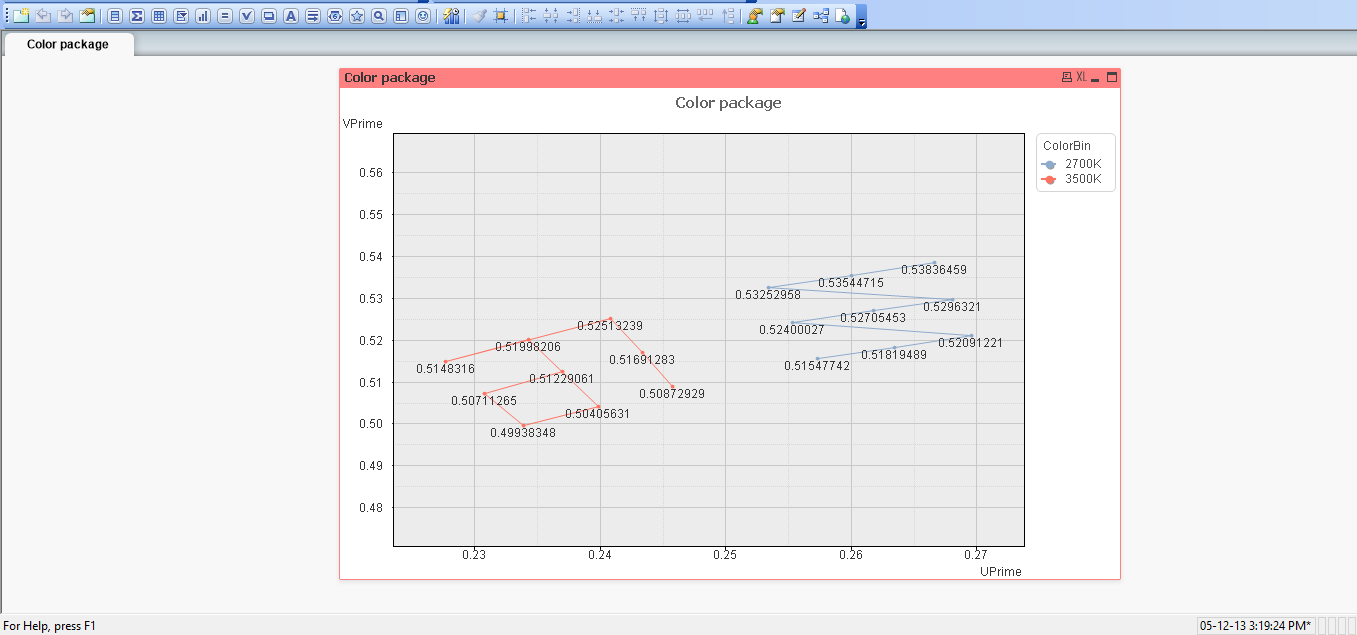
Its seems that QlikView can not connect the points like Excel does, or am I missing something here?
I attached here along is the Excel file, text file of the data, and the QlikView document of the above Scatter Chart. I really hope someone here could help me.
Thank you guys for your kind attention.
Regards,
Khairul