Unlock a world of possibilities! Login now and discover the exclusive benefits awaiting you.
- Qlik Community
- :
- All Forums
- :
- QlikView App Dev
- :
- Re: Plotting the distribution of timestamps
- Subscribe to RSS Feed
- Mark Topic as New
- Mark Topic as Read
- Float this Topic for Current User
- Bookmark
- Subscribe
- Mute
- Printer Friendly Page
- Mark as New
- Bookmark
- Subscribe
- Mute
- Subscribe to RSS Feed
- Permalink
- Report Inappropriate Content
Plotting the distribution of timestamps
Dear all,
I am developing some histograms that show a time series distribution, using the difference between two timestamps.
I am using a calculated dimension, as follows:
=Round(Aggr(Interval(Only({$<OP_NAME={'Assess'}>}CLOSED_DATE_TIME) - Only({$<OP_NAME={'Validate'}>}CLOSED_DATE_TIME),'mm'),INSTANCEID),BinWidth)
So, the output of this expression is the time in minutes between 2 timestamps that are identified based on a related description field in the database table. BinWidth is a variable that can be set on the screen. (Thankyou Henric Cronstrom for an easy to follow description of how to do this).
In the expression field, I am running a simple count of each record that falls into each column of the histogram, based on the binwidth.
The result looks like this; which is a great first step.
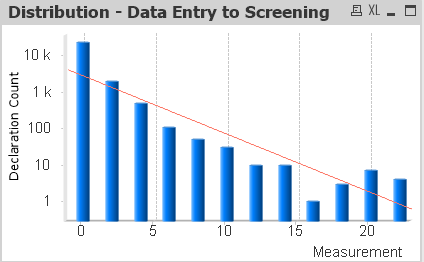
What I want to achieve now is to have the X axis being the interval time in minutes, not a binwidth. This would range from 0 where the difference in timestamps is very close, to typically around 180 minutes.
How can I modify the calculated dimension above so that the x axis plots the histogram column based on the interval calculated, rather than using binwidth?
Thanks in advance for any advice you can provide.
Mike
Accepted Solutions
- Mark as New
- Bookmark
- Subscribe
- Mute
- Subscribe to RSS Feed
- Permalink
- Report Inappropriate Content
OK so class works, but might not display quite how you want?
Your expression would be (Sorry might have messed up the brackets)
=class((num(Aggr(Interval(Only({$<OP_NAME={'Assess'}>}CLOSED_DATE_TIME) - Only({$<OP_NAME={'Validate'}>}CLOSED_DATE_TIME),'mm'),INSTANCEID)*24*60,'0')),100)
- Mark as New
- Bookmark
- Subscribe
- Mute
- Subscribe to RSS Feed
- Permalink
- Report Inappropriate Content
Hi Mike,
I might be way off but doesn't:
=Interval(Only({$<OP_NAME={'Assess'}>}CLOSED_DATE_TIME) - Only({$<OP_NAME={'Validate'}>}CLOSED_DATE_TIME),'mm')
simply do the trick for you?
- Mark as New
- Bookmark
- Subscribe
- Mute
- Subscribe to RSS Feed
- Permalink
- Report Inappropriate Content
Hi Adam,
Not quite.... Unfortunately I get an Error in Calculated dimension if I do that.
The expression is being run across a set of thousands of timestamps, so I need to put the expression through an aggregate function, based on a unique key, so that every record in the set is parsed.
As an experiment, I took your idea, and wrapped the aggregate function around it like so:
=Aggr(Interval(Only({$<OP_NAME={'Assess'}>}CLOSED_DATE_TIME) - Only({$<OP_NAME={'Validate'}>}CLOSED_DATE_TIME),'mm'),INSTANCEID)
The graph now looks wrong, and when I convert the output to a table, I can see that it is not ordering the results into equal parts (which is what the BinWidth variable does....
What the picture below shows is a record by record breakdown of each record and it's Interval. THe Measurement ranges from 00 to approx 180 mins.
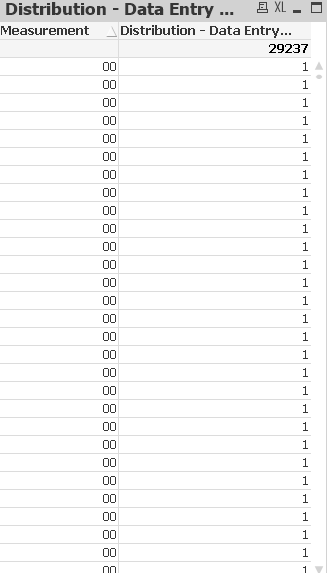
So the question is, how can I customise the BinWidth to show the scale that I require?
- Mark as New
- Bookmark
- Subscribe
- Mute
- Subscribe to RSS Feed
- Permalink
- Report Inappropriate Content
Hi Michael,
No that does make sense, there is a trick you can do and this is from memory so bear with me while I try and drag is up from the recesses of my brain!
Something like:
round((Aggr(Interval(Only({$<OP_NAME={'Assess'}>}CLOSED_DATE_TIME) - Only({$<OP_NAME={'Validate'}>}CLOSED_DATE_TIME),'mm'),INSTANCEID))/BinWidth)*BinWidth)
- Mark as New
- Bookmark
- Subscribe
- Mute
- Subscribe to RSS Feed
- Permalink
- Report Inappropriate Content
Ahhh,
I removed the last bracket and created the calculated dimension as follows:
=round((Aggr(Interval(Only({$<OP_NAME={'Assess'}>}CLOSED_DATE_TIME) - Only({$<OP_NAME={'Validate'}>}CLOSED_DATE_TIME),'mm'),INSTANCEID))/BinWidth)*BinWidth
When I look at the raw data, the largest time interval in the set is 510 (minutes), so i'm expecting the graph to scale from 0 to 510. (I've set binwidth to 1)
In reality the graph x axis is scaling to 22. Any other ideas?
- Mark as New
- Bookmark
- Subscribe
- Mute
- Subscribe to RSS Feed
- Permalink
- Report Inappropriate Content
Sorry the downside to writing on the fly.
Let me have a mess around and see if I can remember exactly what the trick is!
- Mark as New
- Bookmark
- Subscribe
- Mute
- Subscribe to RSS Feed
- Permalink
- Report Inappropriate Content
Thanks for your perseverance!
- Mark as New
- Bookmark
- Subscribe
- Mute
- Subscribe to RSS Feed
- Permalink
- Report Inappropriate Content
OK so class works, but might not display quite how you want?
Your expression would be (Sorry might have messed up the brackets)
=class((num(Aggr(Interval(Only({$<OP_NAME={'Assess'}>}CLOSED_DATE_TIME) - Only({$<OP_NAME={'Validate'}>}CLOSED_DATE_TIME),'mm'),INSTANCEID)*24*60,'0')),100)
- Mark as New
- Bookmark
- Subscribe
- Mute
- Subscribe to RSS Feed
- Permalink
- Report Inappropriate Content
Hi Adam,
I was looking at Class, but couldn't work out the syntax when dealing with time. That is brilliant; I can work with that.... Thanks so much for your help!
Regards,
Mike
- Mark as New
- Bookmark
- Subscribe
- Mute
- Subscribe to RSS Feed
- Permalink
- Report Inappropriate Content
Hi Mike,
Yep the trick with intervals is that it stores it as a part of a day so you need the 60*24 to get it to a decent numeric format!
And it isn't an issue, I like a challenge 
Kind regards
Adam