Unlock a world of possibilities! Login now and discover the exclusive benefits awaiting you.
- Qlik Community
- :
- All Forums
- :
- QlikView App Dev
- :
- Re: Possible to only show the Subtotal column in a...
- Subscribe to RSS Feed
- Mark Topic as New
- Mark Topic as Read
- Float this Topic for Current User
- Bookmark
- Subscribe
- Mute
- Printer Friendly Page
- Mark as New
- Bookmark
- Subscribe
- Mute
- Subscribe to RSS Feed
- Permalink
- Report Inappropriate Content
Possible to only show the Subtotal column in a table?
Hi
I wonder if there is a way to only show the subtotals in a table.
| Sales Office/Product | P1 | P2 | P3 | P4 | P5 | P6 | Total |
| O1 | 3 | 1 | 2 | 0 | 2 | 5 | 13 |
| O2 | 4 | 2 | 4 | 2 | 3 | 1 | 16 |
| O3 | 5 | 3 | 3 | 3 | 1 | 2 | 17 |
| O4 | 2 | 0 | 2 | 2 | 2 | 3 | 11 |
| O5 | 1 | 2 | 3 | 1 | 3 | 4 | 14 |
| O6 | 2 | 6 | 4 | 1 | 4 | 3 | 20 |
| Total | 17 | 14 | 18 | 9 | 15 | 18 |
The table above as an example. I want one table that only show the sales offices and the total column and I want one table that show only the products and the total row. All other columns and rows should be hidden. Is that possible to do? Thanks for any help.
//Fredrik
Accepted Solutions
- Mark as New
- Bookmark
- Subscribe
- Mute
- Subscribe to RSS Feed
- Permalink
- Report Inappropriate Content
I am not sure I understand your issue completely.
You are now using a (pivot) table chart with two dimensions(SO and Product), right?
Create two new tables, one with only dimension Sales Office and one with only dimension Product.
- Mark as New
- Bookmark
- Subscribe
- Mute
- Subscribe to RSS Feed
- Permalink
- Report Inappropriate Content
Hi,
In list box, it's possible to add expressions. With that in mind, you can create a list box for your products, and there, you can add an expression with sum(whateverYouSum).
The same for Sales Office: Put it in a list box, and add an expression.
- Mark as New
- Bookmark
- Subscribe
- Mute
- Subscribe to RSS Feed
- Permalink
- Report Inappropriate Content
Do you want it to look something like this?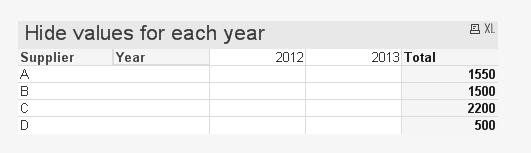
Use a if() condition in your expression. Take a look at the attached QVW.
Best regards
QlikView consultant at egbs consulting ab
Blog (in Swedish): bi-effekten.se
Qlik Community MVP
- Mark as New
- Bookmark
- Subscribe
- Mute
- Subscribe to RSS Feed
- Permalink
- Report Inappropriate Content
Yea this is the right answer  . The table was more complex so I couldnt see hte forest for all the trees
  . I am also new with Qlikview so havent learned by heart what is possible to do.
- Mark as New
- Bookmark
- Subscribe
- Mute
- Subscribe to RSS Feed
- Permalink
- Report Inappropriate Content
Thank you. This is useful information,
- Mark as New
- Bookmark
- Subscribe
- Mute
- Subscribe to RSS Feed
- Permalink
- Report Inappropriate Content
Thank you this is also useful information that I probably have to apply on some other application in the future.