Unlock a world of possibilities! Login now and discover the exclusive benefits awaiting you.
Announcements
SYSTEM MAINTENANCE: Thurs., Sept. 19, 1 AM ET, Platform will be unavailable for approx. 60 minutes.
- Qlik Community
- :
- All Forums
- :
- QlikView App Dev
- :
- Possible to show X axis intervals as discrete/visu...
Options
- Subscribe to RSS Feed
- Mark Topic as New
- Mark Topic as Read
- Float this Topic for Current User
- Bookmark
- Subscribe
- Mute
- Printer Friendly Page
Turn on suggestions
Auto-suggest helps you quickly narrow down your search results by suggesting possible matches as you type.
Showing results for
Creator III
2016-03-09
07:36 PM
- Mark as New
- Bookmark
- Subscribe
- Mute
- Subscribe to RSS Feed
- Permalink
- Report Inappropriate Content
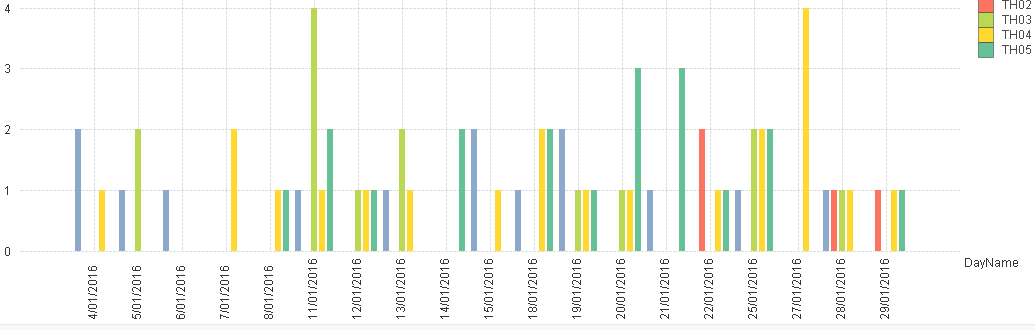
Possible to show X axis intervals as discrete/visula units?
Hi
I have the chart displaying as show below - but it is hard to see where one day ends and another begins.
Is there a way of emphasising the boundary between the days?
so something like this - ie stronger grid lines or something like that
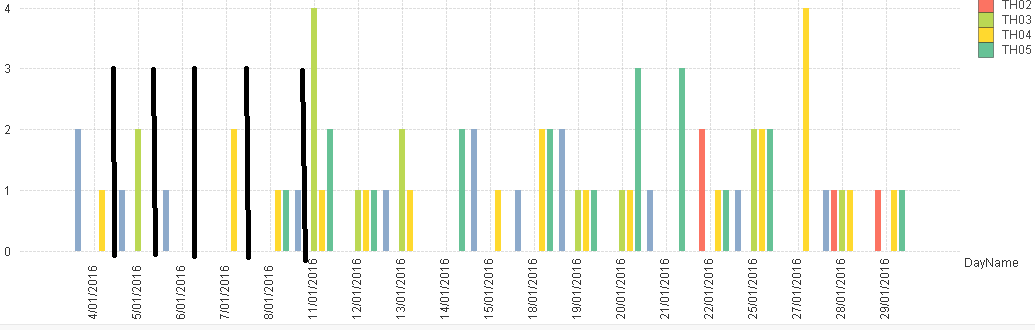
Thank you
Jo
230 Views
1 Reply
Creator III
2016-03-09
07:40 PM
Author
- Mark as New
- Bookmark
- Subscribe
- Mute
- Subscribe to RSS Feed
- Permalink
- Report Inappropriate Content
Space between groups of bars in a bar chart
Sorry I seem to have answered my own question - it does not seem to be possible ... I looked up the post above.
Jo
188 Views