Unlock a world of possibilities! Login now and discover the exclusive benefits awaiting you.
- Qlik Community
- :
- All Forums
- :
- QlikView App Dev
- :
- Re: Previous Quarter Calculation
- Subscribe to RSS Feed
- Mark Topic as New
- Mark Topic as Read
- Float this Topic for Current User
- Bookmark
- Subscribe
- Mute
- Printer Friendly Page
- Mark as New
- Bookmark
- Subscribe
- Mute
- Subscribe to RSS Feed
- Permalink
- Report Inappropriate Content
Previous Quarter Calculation
Hi all,
I'm trying to resolve an issue that I think should be fairly simple, but I can't seem to get my head around it. Maybe I've just been staring at it too long. I need to generate a "Starting" value based on the data set below to generate the shown pivot table (obv a very simple sample set).
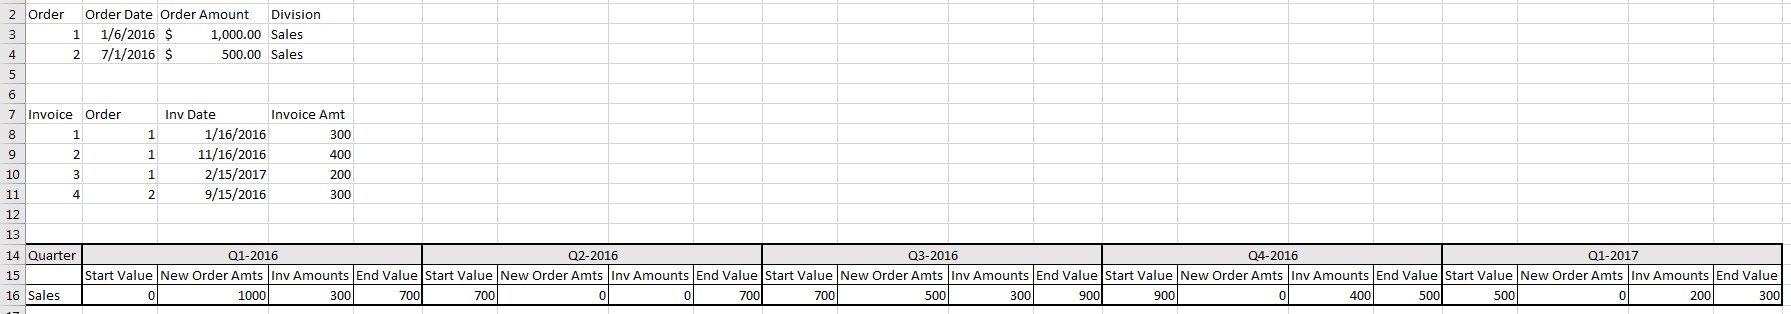
The "Start" amount should be, in essence, the "End" value of the previous quarter (sum(NewOrders)-sum(Invoices). However, in order to ensure the proper flexibility of selection, I am trying to perform a calculation to generate this data set, using the order and invoice dates and the proper Quarters associated. I think I just need to step away and maybe get a second set of eyes here, so any help would be greatly appreciated.
Start = sum(<Previous Qtr> Order Amount) - sum(<Previous Qtr> Invoice Amt)
New = sum(Order Amount)
Inv = sum(Invoice Amt)
End = (Start+New)-Inv
I can also attempt to script a summary data set, but if it can be done in the table expressions, that would provide me the most value.
- « Previous Replies
-
- 1
- 2
- Next Replies »
- Mark as New
- Bookmark
- Subscribe
- Mute
- Subscribe to RSS Feed
- Permalink
- Report Inappropriate Content
Sample code attached. Note that the Calendar has standard calendar fields and fiscal (ENT_ prefix).
I am not certain my code is correct either, so I am more than open to suggestions.
As some additional thought processes, in reality, the calculation I need is the aggregation summation of (new orders)-(invoices) over the time period prior to the dimension of the table. So, for say, Q1-2017, I would want the sum of all new orders - total invoices for all dates prior to the start of Q1-2017, which would give me my "Start" value.
- Mark as New
- Bookmark
- Subscribe
- Mute
- Subscribe to RSS Feed
- Permalink
- Report Inappropriate Content
Does that look right to you or not?

- Mark as New
- Bookmark
- Subscribe
- Mute
- Subscribe to RSS Feed
- Permalink
- Report Inappropriate Content
I think that looks pretty good. I think you hit on what I was missing, which is filling in the "gaps" in the date sequences to get the sequential quarters to work properly.
Let me work with this for a bit and I'll get back on here either way.
Thank you for all your help Sunny!
- Mark as New
- Bookmark
- Subscribe
- Mute
- Subscribe to RSS Feed
- Permalink
- Report Inappropriate Content
Hi Sunny. I think that this is very close, and I'm going to play around with it a little, but it appears to break down if we change the sort of the chart. The chart needs to be sorted by Quarters asc, so Q4-2015, Q1-2016, Q2-2016, etc.
The chart you built works great, but the sorting is incorrect - Q1-2017, Q2-2016, Q3-2016.
If I change the sort order to align properly, the chart changes its presentation to this:

If you look at Q2-2016, it sets the Start value to 0, because this is only looking at the previous quarter New/Inv data, but in reality, it needs to aggregate all the New/Inv numbers for all previous quarters. That is another approach I am looking into. To not necessarily focus on a quarter-by-quarter calculation, but just aggregating previous quarterly data over time.
- Mark as New
- Bookmark
- Subscribe
- Mute
- Subscribe to RSS Feed
- Permalink
- Report Inappropriate Content
If you change the sorting and you still want the same result, then you can use After instead of Before

- Mark as New
- Bookmark
- Subscribe
- Mute
- Subscribe to RSS Feed
- Permalink
- Report Inappropriate Content
Still not quite right. If you add the dimensions for LOB and Sales Order, the numbers don't add up. I think this has to include some combination of the before/after expression, but also a RangeSum.
In essence, this is a rolling sum of the New-Inv amounts over time, presented within each Quarter.
- Mark as New
- Bookmark
- Subscribe
- Mute
- Subscribe to RSS Feed
- Permalink
- Report Inappropriate Content
What is the output you expect to see? May be if I know the numbers I am able to get, I might be able to help better 
- Mark as New
- Bookmark
- Subscribe
- Mute
- Subscribe to RSS Feed
- Permalink
- Report Inappropriate Content
Hi Sunny. I probably should have created a better sample screenshot at the initial post
Based on the mocked up data, this is roughly what I am trying to get created:
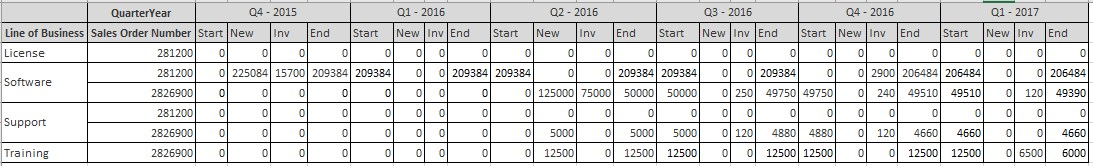
As you'll notice, the Start value for each quarter is, basically, the running total of (New-Inv) over the previous timeframes, and the End value is the addition of that Quarters (New-Inv). So, it really is more of a running sum, than necessarily a Previous Quarter calculation. And that is my mistake as to how I presented it in the initial thread.
The 0 values don't need to be displayed as such. Nulls() are OK, as long as the overall numbers sum properly.
- Mark as New
- Bookmark
- Subscribe
- Mute
- Subscribe to RSS Feed
- Permalink
- Report Inappropriate Content
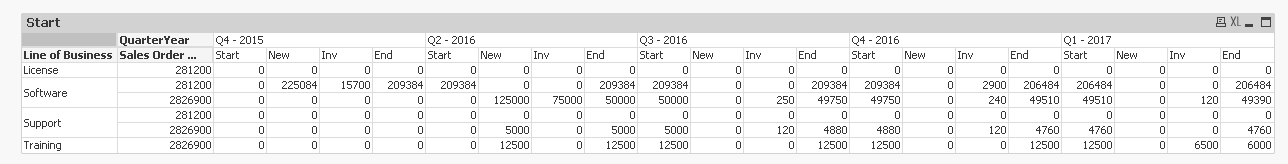
Here (besides some potential typos in your attachement above the expression seems to work) this seems to be working
Start
RangeSum(Before(Sum({<QuarterYear>}[Order Amount]), 1, ColumnNo())) - RangeSum(Before(Sum({<QuarterYear>}[Total Global Rev Amt]), 1, ColumnNo())) * Avg(TOTAL 1)
- Mark as New
- Bookmark
- Subscribe
- Mute
- Subscribe to RSS Feed
- Permalink
- Report Inappropriate Content
Thank you Sunny! (Guess I should have finished my morning coffee before trying to do math in my head to make that chart ).
This looks like it's working exactly as I need it. Or, at least it gets me over the hurdle to move forward. Thank you for all your help. I really do appreciate it.
You're my hero for sure today!
- « Previous Replies
-
- 1
- 2
- Next Replies »