Unlock a world of possibilities! Login now and discover the exclusive benefits awaiting you.
- Qlik Community
- :
- All Forums
- :
- QlikView App Dev
- :
- Re: Previous Year to selected year month wise resu...
- Subscribe to RSS Feed
- Mark Topic as New
- Mark Topic as Read
- Float this Topic for Current User
- Bookmark
- Subscribe
- Mute
- Printer Friendly Page
- Mark as New
- Bookmark
- Subscribe
- Mute
- Subscribe to RSS Feed
- Permalink
- Report Inappropriate Content
Previous Year to selected year month wise results in straight table
Hi Team,
I have my data:
load * Inline [
Year, Month, Sales
2012,1,1000
2012,2,2000
2012,3,3000
2012,4,1000
2012,5,1000
2012,6,1000
2012,7,1000
2013,1,1000
2013,2,1000
2013,3,1000
2013,4,1000
2013,5,1000
2013,6,1000
];
I have two listboxes for Year and Month. When user selects 2013 and month 6, I want to display the details from 2012 month 6 to 2013 month 5 in a straight table.
Can you please help. I am unable to attach a sample qvw file
Accepted Solutions
- Mark as New
- Bookmark
- Subscribe
- Mute
- Subscribe to RSS Feed
- Permalink
- Report Inappropriate Content
Hi S V,
Try below expression,
sum({<Month = {"<=$(=Month-1)"},Year={"$(=Year)"}>}Sales)
+ sum({<Month = {">=$(=Month-1)"},Year={"$(=Year-1)"}>}Sales)
File attached against your data. Let me know.
- Mark as New
- Bookmark
- Subscribe
- Mute
- Subscribe to RSS Feed
- Permalink
- Report Inappropriate Content
add a field to your table
Z:
load *, 12*(Year(Today())-Year) + Month(Today()) - Month as MonthsAgo
Inline [
Year, Month, Sales
2012,1,1000
2012,2,2000
2012,3,3000
2012,4,1000
2012,5,1000
2012,6,1000
2012,7,1000
2013,1,1000
2013,2,1000
2013,3,1000
2013,4,1000
2013,5,1000
2013,6,1000
];
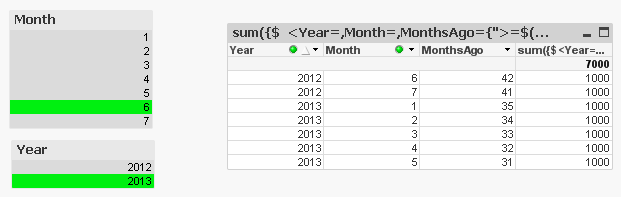
in your chart use the expression (dimensions are Year and Month)
sum({$ <Year=,Month=,MonthsAgo={">=$(=max(MonthsAgo)+1)<=$(=max(MonthsAgo)+12)"}> } Sales)
- Mark as New
- Bookmark
- Subscribe
- Mute
- Subscribe to RSS Feed
- Permalink
- Report Inappropriate Content
Cant we do it without creating an extra field?
Thanks for the quick response
- Mark as New
- Bookmark
- Subscribe
- Mute
- Subscribe to RSS Feed
- Permalink
- Report Inappropriate Content
maybe with an or  in set analysis
max year and month < max month
+
max year -1 and month >= max month
- Mark as New
- Bookmark
- Subscribe
- Mute
- Subscribe to RSS Feed
- Permalink
- Report Inappropriate Content
Hi S V,
Try below expression,
sum({<Month = {"<=$(=Month-1)"},Year={"$(=Year)"}>}Sales)
+ sum({<Month = {">=$(=Month-1)"},Year={"$(=Year-1)"}>}Sales)
File attached against your data. Let me know.
- Mark as New
- Bookmark
- Subscribe
- Mute
- Subscribe to RSS Feed
- Permalink
- Report Inappropriate Content
Thanks alot for the help. It resolved my issue