Unlock a world of possibilities! Login now and discover the exclusive benefits awaiting you.
- Qlik Community
- :
- All Forums
- :
- QlikView App Dev
- :
- Problem hiding minichart/gauge on dimension total ...
- Subscribe to RSS Feed
- Mark Topic as New
- Mark Topic as Read
- Float this Topic for Current User
- Bookmark
- Subscribe
- Mute
- Printer Friendly Page
- Mark as New
- Bookmark
- Subscribe
- Mute
- Subscribe to RSS Feed
- Permalink
- Report Inappropriate Content
Problem hiding minichart/gauge on dimension total line
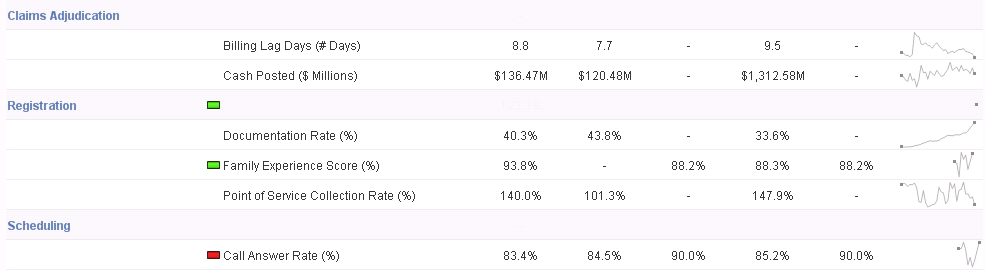
I'm having a problem 'hiding' the gauge and mini chart value on the total line. If you look at the example below, the first total line is fine, and the second one is having the issue. The green gauge is showing up and a small 'dot' is showing up due to the mini chart. The problem appears to happen on every other line, which is really odd. As you can see line 1 and 3 (total lines) are working correctly.
This is a straight table. It has two dimensions, the groupers and the measure name.
Any ideas?
Thanks!
Accepted Solutions
- Mark as New
- Bookmark
- Subscribe
- Mute
- Subscribe to RSS Feed
- Permalink
- Report Inappropriate Content
Have you tried using the dimensionality() function? You can try putting your original expression in an if statement using dimensionality in a condition. Something like if(dimensionality()=2, ...myexpressionhere...). You can first add dimensionality() as expression to see which level gets what value. Looking at your screenshot I guess the detail rows will have a dimensionality of 2, but I might be wrong.
talk is cheap, supply exceeds demand
- Mark as New
- Bookmark
- Subscribe
- Mute
- Subscribe to RSS Feed
- Permalink
- Report Inappropriate Content
Problem solved! This is exactly the function I was looking for. Thanks!
This is what I added to my code:
=If(Dimensionality()=1,Null(),MyExpression)