Unlock a world of possibilities! Login now and discover the exclusive benefits awaiting you.
- Qlik Community
- :
- All Forums
- :
- QlikView App Dev
- :
- Problem in Bottom Analysis
- Subscribe to RSS Feed
- Mark Topic as New
- Mark Topic as Read
- Float this Topic for Current User
- Bookmark
- Subscribe
- Mute
- Printer Friendly Page
- Mark as New
- Bookmark
- Subscribe
- Mute
- Subscribe to RSS Feed
- Permalink
- Report Inappropriate Content
Problem in Bottom Analysis
Hello,
I am using a bar graph to show the top and bottom analysis for products.The Top analysis shown in the graph is correct but i am facing problem in bottom analysis.As soon as i am using 'Smallest' and giving the value=10,no data is displayed on the chart.
I have attached the qvw.Please help me out.
- Tags:
- new_to_qlikview
Accepted Solutions
- Mark as New
- Bookmark
- Subscribe
- Mute
- Subscribe to RSS Feed
- Permalink
- Report Inappropriate Content
Hi
Try like this
Expression:
=fabs(sum({<@Raw_Material ={"=Sum(ILPAID) >0"}>}ILPAID)/10000)
In data model, there are lot of zero values.
Bottom 10 values are zeros. So chart doesn't display zeo values untill uncheck suppress zero values.
Please close the thread by marking correct answer & give likes if you like the post.
- Mark as New
- Bookmark
- Subscribe
- Mute
- Subscribe to RSS Feed
- Permalink
- Report Inappropriate Content
Hi Atul,
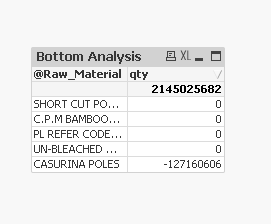
You need to untick - 'Suppress Zero-Values' on the presentation tab, you a many @raw_Material where the qty value is zero and one with a quantity 0f -127160606
HTH Andy
- Mark as New
- Bookmark
- Subscribe
- Mute
- Subscribe to RSS Feed
- Permalink
- Report Inappropriate Content
Hello,
In the qvw shared by you, the reason you are not getting smallest 10 values is because the 10 small values
have sum(ILPAID/10000) as zero.
in the bottom chart go to presentation -- uncheck suppress zero values you will see raw material with 0.
Also you have one -ve value for expression for casurina poles which will not come as fabs function is used.
Hence your qvw is showing accurate results .
Thanks
Khushboo
- Mark as New
- Bookmark
- Subscribe
- Mute
- Subscribe to RSS Feed
- Permalink
- Report Inappropriate Content
Hi
Try like this
Expression:
=fabs(sum({<@Raw_Material ={"=Sum(ILPAID) >0"}>}ILPAID)/10000)
In data model, there are lot of zero values.
Bottom 10 values are zeros. So chart doesn't display zeo values untill uncheck suppress zero values.
Please close the thread by marking correct answer & give likes if you like the post.
- Mark as New
- Bookmark
- Subscribe
- Mute
- Subscribe to RSS Feed
- Permalink
- Report Inappropriate Content
It really helped me...Thankss 