Unlock a world of possibilities! Login now and discover the exclusive benefits awaiting you.
- Qlik Community
- :
- All Forums
- :
- QlikView App Dev
- :
- Re: Problem in Combo chart
- Subscribe to RSS Feed
- Mark Topic as New
- Mark Topic as Read
- Float this Topic for Current User
- Bookmark
- Subscribe
- Mute
- Printer Friendly Page
- Mark as New
- Bookmark
- Subscribe
- Mute
- Subscribe to RSS Feed
- Permalink
- Report Inappropriate Content
Problem in Combo chart
Hi,
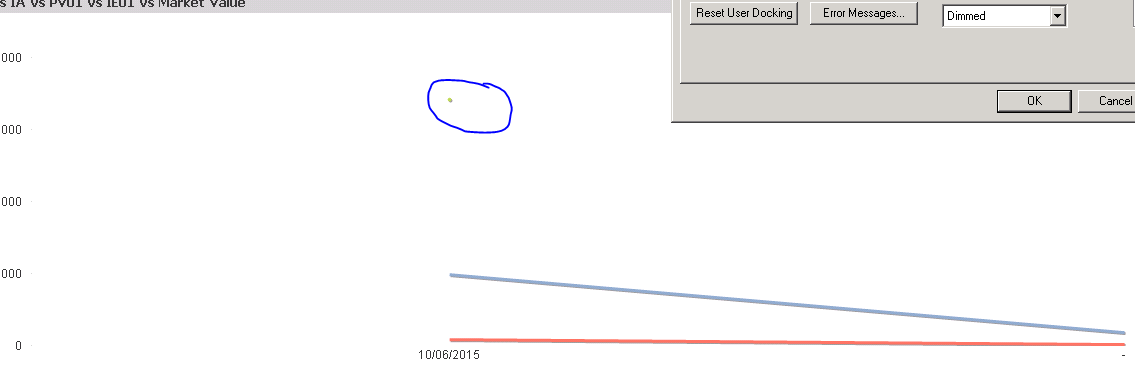
I have the following combo chart... As you can see I have 3 lines plotted over time. Now if I select one day I would like to see the combo chart bar appear. Instead, for one of the figures in green, it only appears as a single dot (in the circle). If it was like the Red or Blue lines will be acceptable. But I would like to see the Bar as it's combo chart. Any ideas why it doesn't work for the green and I can only see the single dot? Thank you!
Panos.
- Tags:
- new_to_qlikview
Accepted Solutions
- Mark as New
- Bookmark
- Subscribe
- Mute
- Subscribe to RSS Feed
- Permalink
- Report Inappropriate Content
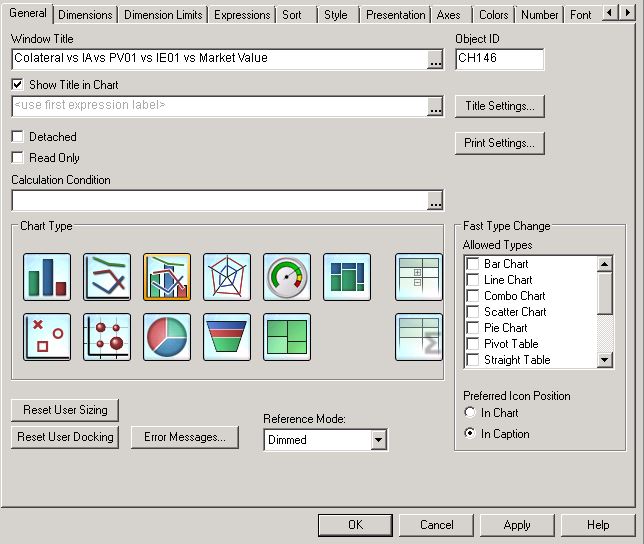
Possibly the dot is coming for a specific expression. Select the expression -> Display option->Check 'Bar' and uncheck symbol.
- Mark as New
- Bookmark
- Subscribe
- Mute
- Subscribe to RSS Feed
- Permalink
- Report Inappropriate Content
Possibly the dot is coming for a specific expression. Select the expression -> Display option->Check 'Bar' and uncheck symbol.
- Mark as New
- Bookmark
- Subscribe
- Mute
- Subscribe to RSS Feed
- Permalink
- Report Inappropriate Content
Change the Graph type to Combo Chart
Repeat the same three expression and in change the type to bar instead of line
select conditional expression of newly created expression and add the following
=if(Count(Date) = 1,1,0)
and do the reverse for the orginal 3 line expressions.
Attached is a example..
Hope this helps
- Mark as New
- Bookmark
- Subscribe
- Mute
- Subscribe to RSS Feed
- Permalink
- Report Inappropriate Content
Hi panlondon,
any chance that you can upload a sample qvw, it makes diagnosing issues easier and quicker?
Andy
- Mark as New
- Bookmark
- Subscribe
- Mute
- Subscribe to RSS Feed
- Permalink
- Report Inappropriate Content
Thanks. I am happy with the bar appearing now I clicked the bar option too, at least the users are. It may just be the dodgy data. Does the if sets the field to appear as yes/ no based on the count of data available. It didn't really do what I wanted to do clicking the bar produces acceptable results.