Unlock a world of possibilities! Login now and discover the exclusive benefits awaiting you.
- Qlik Community
- :
- All Forums
- :
- QlikView App Dev
- :
- Re: Problem with AGGR function
- Subscribe to RSS Feed
- Mark Topic as New
- Mark Topic as Read
- Float this Topic for Current User
- Bookmark
- Subscribe
- Mute
- Printer Friendly Page
- Mark as New
- Bookmark
- Subscribe
- Mute
- Subscribe to RSS Feed
- Permalink
- Report Inappropriate Content
Problem with AGGR function
hi ,
I have a problem with aggr function.
(see attached qvw.)
I have two tables :
- one named PAIE with AMOUNT per COST_C/YEAR/MONTH/PERSO_ID/ACCOUNT
- one named TAX with with TAXE_RATE per YEAR/MONTH/PERSO_ID
I have linked them in qlikview with a key (YEAR/MONTH/PERSO_ID) so every line of PAIE table has the good tax rate from TAX table.
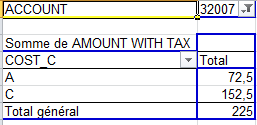
Know, i want to make a pivot table aggregated on COST_C for only ACCOUNT=32007.
In excel, the result would be :
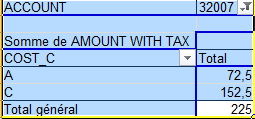
witch is made like this :
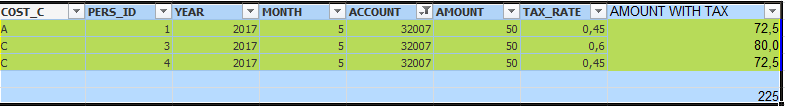
I have tred to do that with set analysis and aggr function but it gives me a wrong result.
Could you help me ?
Thank you very much
Arnault
Accepted Solutions
- Mark as New
- Bookmark
- Subscribe
- Mute
- Subscribe to RSS Feed
- Permalink
- Report Inappropriate Content
Remove other dimensions and Tim's solution seems to be working the way you would want
- Mark as New
- Bookmark
- Subscribe
- Mute
- Subscribe to RSS Feed
- Permalink
- Report Inappropriate Content
try this Expression
sum(AMOUNT) + sum(AMOUNT*TAX_RATE)
or See attended qvw
regards
tim
- Mark as New
- Bookmark
- Subscribe
- Mute
- Subscribe to RSS Feed
- Permalink
- Report Inappropriate Content
Hi,
May be like this?
Sum ({<ACCOUNT={'32007'}>}TAX_RATE)
Result
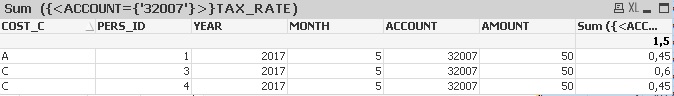
Example at attached file
Regards,
Andrey
- Mark as New
- Bookmark
- Subscribe
- Mute
- Subscribe to RSS Feed
- Permalink
- Report Inappropriate Content
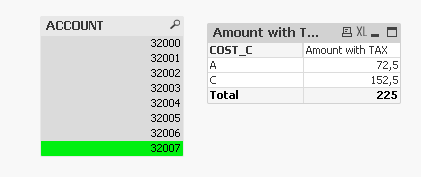
thank you Andrey and Tim,
but i only want to see cost center in the pivot table dimension and the calculation for only three lines witch gives 225.
- Mark as New
- Bookmark
- Subscribe
- Mute
- Subscribe to RSS Feed
- Permalink
- Report Inappropriate Content
Remove other dimensions and Tim's solution seems to be working the way you would want