Unlock a world of possibilities! Login now and discover the exclusive benefits awaiting you.
- Qlik Community
- :
- All Forums
- :
- QlikView App Dev
- :
- Re: Problem with 'Aggr' function and chart
- Subscribe to RSS Feed
- Mark Topic as New
- Mark Topic as Read
- Float this Topic for Current User
- Bookmark
- Subscribe
- Mute
- Printer Friendly Page
- Mark as New
- Bookmark
- Subscribe
- Mute
- Subscribe to RSS Feed
- Permalink
- Report Inappropriate Content
Problem with 'Aggr' function and chart
Hello all,
I have a chart with a 'aggr' function to calculate a share of a product in a certain category ;

(selection Month=12)
For 'Share in Category' I use the function;
Sum (Value) / aggr(NODISTINCT sum(Value),Category)
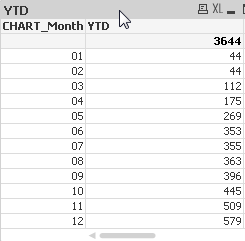
Now I want a chart with on the dimension the months, this looks like this

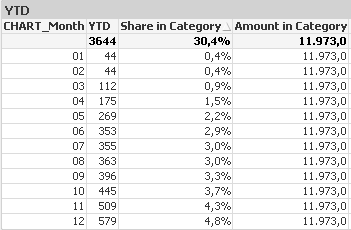
So far all works fine! See the value for month 12 in this table en the value in the first table! Now I want to add the share;

As you see i do not get the right value for share, the problem is the second part of the function;
aggr(NODISTINCT sum(Value),Category)
This one doesn't work right in the the last table, but when I select only one month in the table, it works fine again??!!;

Can anyone help me out here?? Thanks in advance!!
I attached an example!
Accepted Solutions
- Mark as New
- Bookmark
- Subscribe
- Mute
- Subscribe to RSS Feed
- Permalink
- Report Inappropriate Content
Found the solution!;
aggr(NODISTINCT sum({<Product=>}If(InYearToDate(Date#(DateKey,'DD-MM-YYYY'),Date#('01'&'-'&CHART_Month&'-'&$(=PIT_Year),'DD-MM-YYYY'),0), Amount)),Category, CHART_Month)
The problem is that the aggr functions doesn't look to the dimension
- Mark as New
- Bookmark
- Subscribe
- Mute
- Subscribe to RSS Feed
- Permalink
- Report Inappropriate Content
Good Day, Try to use Group By at the script
Live and Breathe Qlik & AWS.
Follow me on my LinkedIn | Know IPC Global at ipc-global.com
- Mark as New
- Bookmark
- Subscribe
- Mute
- Subscribe to RSS Feed
- Permalink
- Report Inappropriate Content
Can you give me an example please?
- Mark as New
- Bookmark
- Subscribe
- Mute
- Subscribe to RSS Feed
- Permalink
- Report Inappropriate Content
Found the solution!;
aggr(NODISTINCT sum({<Product=>}If(InYearToDate(Date#(DateKey,'DD-MM-YYYY'),Date#('01'&'-'&CHART_Month&'-'&$(=PIT_Year),'DD-MM-YYYY'),0), Amount)),Category, CHART_Month)
The problem is that the aggr functions doesn't look to the dimension