Unlock a world of possibilities! Login now and discover the exclusive benefits awaiting you.
- Qlik Community
- :
- All Forums
- :
- QlikView App Dev
- :
- Re: Problem with Line Charts and Bar charts!
- Subscribe to RSS Feed
- Mark Topic as New
- Mark Topic as Read
- Float this Topic for Current User
- Bookmark
- Subscribe
- Mute
- Printer Friendly Page
- Mark as New
- Bookmark
- Subscribe
- Mute
- Subscribe to RSS Feed
- Permalink
- Report Inappropriate Content
Problem with Line Charts and Bar charts!
Hi!
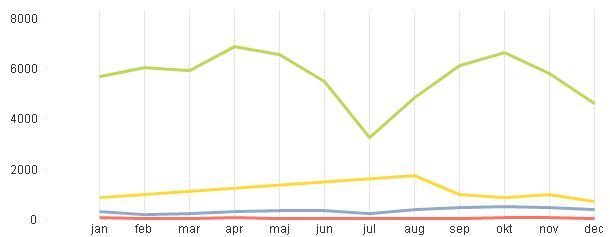
I think i have a wierd problem! When i use Bar chart you can see that the Yellow does not have values for Feb -> Jul and that is right. But in the Line chart the yellow line does have values over these month which is incorrect.
Thanksfull for help!

- Mark as New
- Bookmark
- Subscribe
- Mute
- Subscribe to RSS Feed
- Permalink
- Report Inappropriate Content
Since im a newbie regarding Qlikview, please tell me how to!
- Mark as New
- Bookmark
- Subscribe
- Mute
- Subscribe to RSS Feed
- Permalink
- Report Inappropriate Content
Can't see how that should help sorry.. Still i want the yellow line to show zeros since there is no data there!

- Mark as New
- Bookmark
- Subscribe
- Mute
- Subscribe to RSS Feed
- Permalink
- Report Inappropriate Content
At least you can see that there are no data points.
- Mark as New
- Bookmark
- Subscribe
- Mute
- Subscribe to RSS Feed
- Permalink
- Report Inappropriate Content
Yes, but still it is very confussing for people looking at the graph...
There must be a solution to this problem?
- Mark as New
- Bookmark
- Subscribe
- Mute
- Subscribe to RSS Feed
- Permalink
- Report Inappropriate Content
Could you post an example. Maybe you can use Aggr() or a 2nd dimension..
- Mark as New
- Bookmark
- Subscribe
- Mute
- Subscribe to RSS Feed
- Permalink
- Report Inappropriate Content
What's your expression? If it's a simple sum, you could try something like:
=if( IsNull (sum( field ) ) ), 0, sum( Field ) )
That should put a zero everywhere there is no value.
- Mark as New
- Bookmark
- Subscribe
- Mute
- Subscribe to RSS Feed
- Permalink
- Report Inappropriate Content
NumericCount (date_from)
Is my expression.
- Mark as New
- Bookmark
- Subscribe
- Mute
- Subscribe to RSS Feed
- Permalink
- Report Inappropriate Content
Try Like Below:
IF(IsNull(NumericCount (date_from)) , 0 , NumericCount (date_from))
Uncheck the Supress zero values in the Presenation tab
- Mark as New
- Bookmark
- Subscribe
- Mute
- Subscribe to RSS Feed
- Permalink
- Report Inappropriate Content
Yep, this should do it.
- Mark as New
- Bookmark
- Subscribe
- Mute
- Subscribe to RSS Feed
- Permalink
- Report Inappropriate Content
I have unchecked the Supress Zero, and used your expression.
Is does not work 😕 Still the yellow line is there.