Unlock a world of possibilities! Login now and discover the exclusive benefits awaiting you.
- Qlik Community
- :
- All Forums
- :
- QlikView App Dev
- :
- Re: Re: Problem with % expression in chart
- Subscribe to RSS Feed
- Mark Topic as New
- Mark Topic as Read
- Float this Topic for Current User
- Bookmark
- Subscribe
- Mute
- Printer Friendly Page
- Mark as New
- Bookmark
- Subscribe
- Mute
- Subscribe to RSS Feed
- Permalink
- Report Inappropriate Content
Problem with % expression in chart
Hello everyone,
I'm strugling again with creating an expression in a chart.
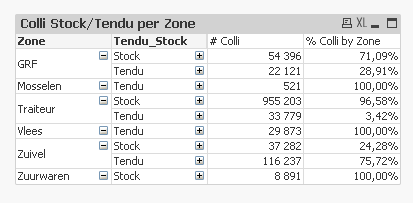
I have 3 fields called Zone ,Tendu/Stock and Colli.
I want to see by Zone how may % is Tendu and how many % is Stock in a chart.
No clue what so ever on how I can manage this, can someone help me please, I've attached the QVW with the data.
Kind regards,
Monique
- Tags:
- new_to_qlikview
- « Previous Replies
-
- 1
- 2
- Next Replies »
Accepted Solutions
- Mark as New
- Bookmark
- Subscribe
- Mute
- Subscribe to RSS Feed
- Permalink
- Report Inappropriate Content
See attached
- Mark as New
- Bookmark
- Subscribe
- Mute
- Subscribe to RSS Feed
- Permalink
- Report Inappropriate Content
Are you trying to see by zone what percent of the colli are stock or tendu?
- Mark as New
- Bookmark
- Subscribe
- Mute
- Subscribe to RSS Feed
- Permalink
- Report Inappropriate Content
Yes that's what I'm trying to see but I want to see both Stock % and Tendu %
Both accumulated should be 100%
- Mark as New
- Bookmark
- Subscribe
- Mute
- Subscribe to RSS Feed
- Permalink
- Report Inappropriate Content
if you want this
- remove dimension Colli
- add expression Sum(Colli) / sum(TOTAL <Zone> Colli)
and format in Number tab
if not, you probably have to play with the TOTAL
- Mark as New
- Bookmark
- Subscribe
- Mute
- Subscribe to RSS Feed
- Permalink
- Report Inappropriate Content
See attached
- Mark as New
- Bookmark
- Subscribe
- Mute
- Subscribe to RSS Feed
- Permalink
- Report Inappropriate Content
Check if this helps .
- Mark as New
- Bookmark
- Subscribe
- Mute
- Subscribe to RSS Feed
- Permalink
- Report Inappropriate Content
Like this?
- Mark as New
- Bookmark
- Subscribe
- Mute
- Subscribe to RSS Feed
- Permalink
- Report Inappropriate Content
I hope this helps.
- Mark as New
- Bookmark
- Subscribe
- Mute
- Subscribe to RSS Feed
- Permalink
- Report Inappropriate Content
Thank you so much, can you explain to me how the expression is working step by step please?
I don't just want to copy code but try to understand so I can manage these things myself.
Monique
- Mark as New
- Bookmark
- Subscribe
- Mute
- Subscribe to RSS Feed
- Permalink
- Report Inappropriate Content
Yes this is very clear but I've seen a different way of expression that is not completly clear to me:
sum([Colli]) / Sum(TOTAL<Zone>Colli)
- « Previous Replies
-
- 1
- 2
- Next Replies »