Unlock a world of possibilities! Login now and discover the exclusive benefits awaiting you.
- Qlik Community
- :
- All Forums
- :
- QlikView App Dev
- :
- Problem with min and max count using set analysis
- Subscribe to RSS Feed
- Mark Topic as New
- Mark Topic as Read
- Float this Topic for Current User
- Bookmark
- Subscribe
- Mute
- Printer Friendly Page
- Mark as New
- Bookmark
- Subscribe
- Mute
- Subscribe to RSS Feed
- Permalink
- Report Inappropriate Content
Problem with min and max count using set analysis
Hi
Can anyone help?
I'm trying to display the min count and also the max count of items in column B on any one day. I have tried the aggr function and group by in script but to no avail.
Date B
01/01/2014 ABC
01/01/2014 BDC
01/01/2014 DEF
02/01/2014 CAD
02/01/2014 ABC
03/01/2014 ABC
The result that I'm after is min = 1 and max = 3
I'm sure it must be something really simple that I'm missing here?
Any help would be much appreciated.
Thanks
Accepted Solutions
- Mark as New
- Bookmark
- Subscribe
- Mute
- Subscribe to RSS Feed
- Permalink
- Report Inappropriate Content
in a text box
'Min = ' & min(aggr(count(distinct B),Date))
& chr(10) &
'Max = ' & max(aggr(count(distinct B),Date))
- Mark as New
- Bookmark
- Subscribe
- Mute
- Subscribe to RSS Feed
- Permalink
- Report Inappropriate Content
To find min = 1 and max = 3 on column B
freq:
LOAD * Inline
[
Date, B
01/01/2014, ABC
01/01/2014, BDC
01/01/2014, DEF
02/01/2014, CAD
02/01/2014, ABC
03/01/2014, ABC
];
NoConcatenate
MaxMinFind:
LOAD
B as Bid,
Count(B) as Freq
Resident freq
Group By B
Order by B asc;
Let vMax = Peek('Freq',0,'MaxMinFind');
Let vMin = Peek('Freq',-1,'MaxMinFind');
DROP Table MaxMinFind;
And plot two text box and display Max and Min values like
=vMin and =vMax
- Mark as New
- Bookmark
- Subscribe
- Mute
- Subscribe to RSS Feed
- Permalink
- Report Inappropriate Content
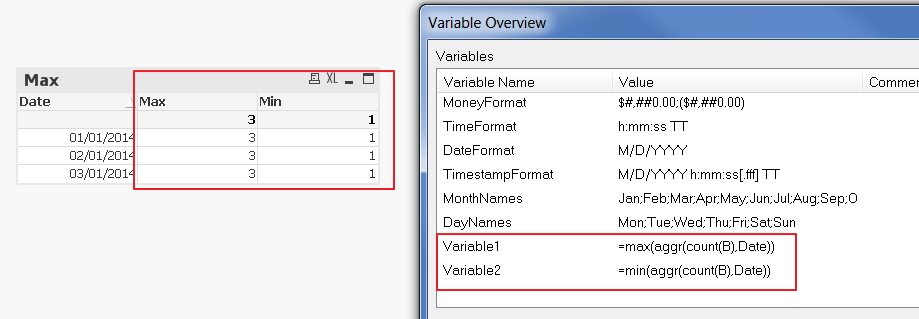
You can do it with the help of variables.
See attached QVW.
- Mark as New
- Bookmark
- Subscribe
- Mute
- Subscribe to RSS Feed
- Permalink
- Report Inappropriate Content
in a text box
'Min = ' & min(aggr(count(distinct B),Date))
& chr(10) &
'Max = ' & max(aggr(count(distinct B),Date))
- Mark as New
- Bookmark
- Subscribe
- Mute
- Subscribe to RSS Feed
- Permalink
- Report Inappropriate Content
This worked well. Thank you 
- Mark as New
- Bookmark
- Subscribe
- Mute
- Subscribe to RSS Feed
- Permalink
- Report Inappropriate Content
This works well - thank you for your help