Unlock a world of possibilities! Login now and discover the exclusive benefits awaiting you.
- Qlik Community
- :
- All Forums
- :
- QlikView App Dev
- :
- Re: Problem with percentage calculation in Trellis...
- Subscribe to RSS Feed
- Mark Topic as New
- Mark Topic as Read
- Float this Topic for Current User
- Bookmark
- Subscribe
- Mute
- Printer Friendly Page
- Mark as New
- Bookmark
- Subscribe
- Mute
- Subscribe to RSS Feed
- Permalink
- Report Inappropriate Content
Problem with percentage calculation in Trellis charts
Hey all
I have a problem with calculation percentage in Trelllis charts.
I want to show the enrollment of Bachelor- and Masterstudents in 8 different Universities in Denmark in a Trellis chart. I have no problem showing the actual number in my first Trellis Chart, but I also want a Trellis Chart where I have calculated the ration (in %)of all Bachelorstudents enrolled in each University divided by all enrolled Bachelorstudents in Total. The data ratio should sum to 100% in each of the Years in the Chart (2007-2013) . Likewise I want the same percentage for Masterstudents in the Chart (called "Kandidat" in Danish).
I use these dimensions/expression:
Dimensions:
- University
- Year
- Type (Bachelor/Master)
Expression:
=sum({$<Status={'Samlet'}, Type={'dkuni, optag'}>} sum) / sum({$<Status={'Samlet'}, Type={'dkuni, optag'}>} TOTAL sum)
Listbox (where I select from Faculties - in the case in the Picture underneath it is "Humaniora" which 6 Universities have)
However my Trellis Charts looks like this:
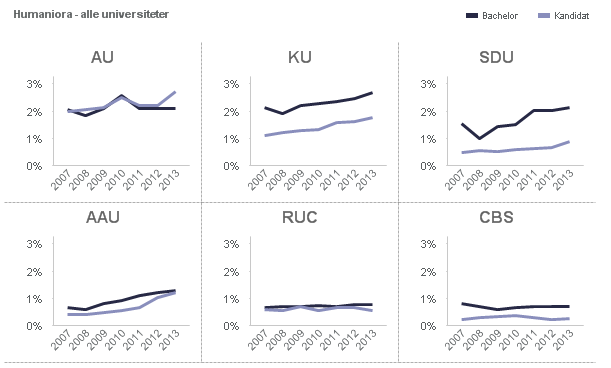
Clearly the percentages are not calculated correctly - what am I doing wrong?
I have attached my data in excel-format
Hope somebody can help - thanx 
Cheers
Bruno
- Tags:
- new_to_qlikview
- « Previous Replies
-
- 1
- 2
- Next Replies »
Accepted Solutions
- Mark as New
- Bookmark
- Subscribe
- Mute
- Subscribe to RSS Feed
- Permalink
- Report Inappropriate Content
Like This ?
Update :
Change your expressions as below..
for Bachelor
=Sum({<Degree={'Bachelor'}>}Val)/Sum(TOTAL <Year> {<Degree={'Bachelor'}>}Val)
for Kandidat
=Sum({<Degree={'Kandidat'}>}Val)/Sum(TOTAL <Year> {<Degree={'Kandidat'}>}Val)
- Mark as New
- Bookmark
- Subscribe
- Mute
- Subscribe to RSS Feed
- Permalink
- Report Inappropriate Content
Not clearly understood your question.
Can you let me know what could be the result you are expecting?
- Mark as New
- Bookmark
- Subscribe
- Mute
- Subscribe to RSS Feed
- Permalink
- Report Inappropriate Content
Hi,
Please find the attached.
Thanks,
Jagan
- Mark as New
- Bookmark
- Subscribe
- Mute
- Subscribe to RSS Feed
- Permalink
- Report Inappropriate Content
Hi Jagan
Thanks for your answer, but it's not quite what I was looking for. I guess I was not specific enough in my original post - my fault, sorry
To be more specific:
The user have to choose one, and only one Faculty. But the expression calculates the percentage out of all 5 faculties together and not for each faculty as I wanted. (the selected Faculty should sum to 100 % if all Universities are summed for bachelorstudents and to 100% if all Universities for masterstudents summed)
Is this something you know how to do?
Thanks a lot
Cheers
Bruno
- Mark as New
- Bookmark
- Subscribe
- Mute
- Subscribe to RSS Feed
- Permalink
- Report Inappropriate Content
Bruno,
Still we are confuse. Can you explain little bit more. If possible give output result what you are expecting.
Thanks,
Jagan
- Mark as New
- Bookmark
- Subscribe
- Mute
- Subscribe to RSS Feed
- Permalink
- Report Inappropriate Content
Hi Jagan
I can try - here it goes.
I have only one listbox where the user can choose 1 (and only 1) of 5 faculties. Given by an example:
If I choose Faculty='Humaniora', the following Trellis Chart should show (Each single chart represents 1 of the 6 Universities that have the Faculty 'Humaniora'):
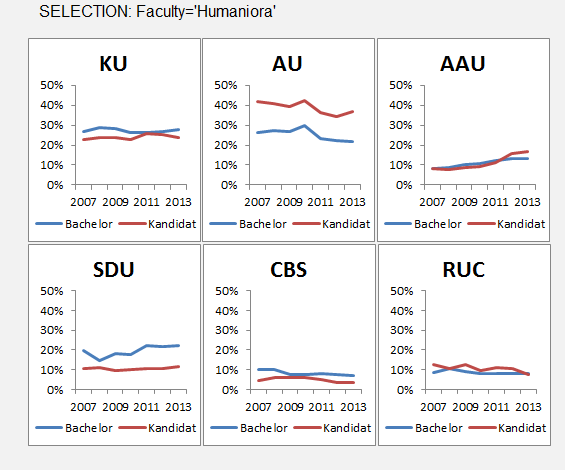
Mark the for each Year AND each Type (Bachelor/Kandidat) the cumulutative percent for all Universities adds up to 100%. If I choose another Faculty (for example 'Samfundsvidenskab'), the new Trellis chart would look like this:
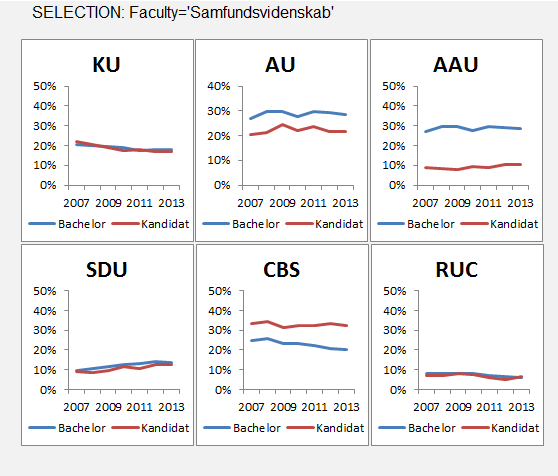
Again the cumulutative percentage for each Year and each Type adds up to 100 %. Thats what I want my Trellis Chart to do.
I hope this makes it clearer, and that you have a solution
Thanks in advance
Cheers
Bruno
- Mark as New
- Bookmark
- Subscribe
- Mute
- Subscribe to RSS Feed
- Permalink
- Report Inappropriate Content
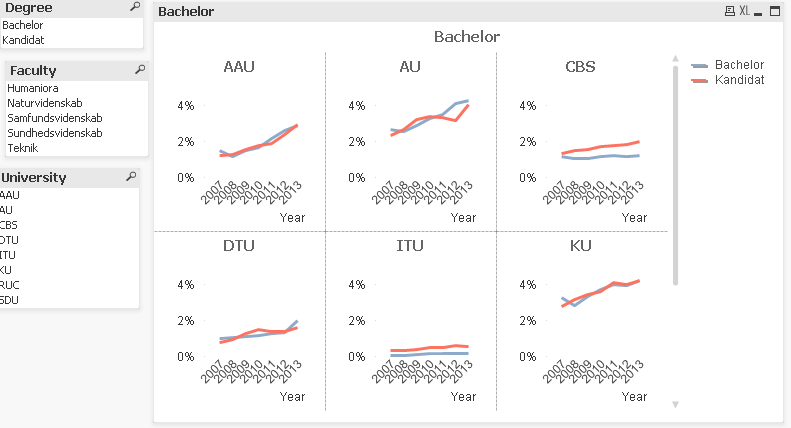
Hi,
Please find the attached file.
I had calculated like this,
Bachelor Exp:
100*(Sum of Bachelor value for each university and year / Sum of total Bachelor value for all university and years(i.e. total value for all university and all years) )
- In numbers tab I had checked Show percent. It will calculate the exp with 100
- Based on selection in faculty the expression will change in Numerator and denominator.
If you select Humaniora, it gives the result based on Humaniora.
If you don't want to change denominator based on your current selection in app, use {1}. If you want to remove Faculty selection in denominator, use {<Faculty =>}
Thanks,
Jagan
- Mark as New
- Bookmark
- Subscribe
- Mute
- Subscribe to RSS Feed
- Permalink
- Report Inappropriate Content
Like This ?
Update :
Change your expressions as below..
for Bachelor
=Sum({<Degree={'Bachelor'}>}Val)/Sum(TOTAL <Year> {<Degree={'Bachelor'}>}Val)
for Kandidat
=Sum({<Degree={'Kandidat'}>}Val)/Sum(TOTAL <Year> {<Degree={'Kandidat'}>}Val)
- Mark as New
- Bookmark
- Subscribe
- Mute
- Subscribe to RSS Feed
- Permalink
- Report Inappropriate Content
Bruno- You can use Manish expression if you need total years value in each trills chart.
- Mark as New
- Bookmark
- Subscribe
- Mute
- Subscribe to RSS Feed
- Permalink
- Report Inappropriate Content
Hi Jagan
Thanks for your answers, but I'm sorry to tell you that I'ts still not what I want the Trellis to show.
From my first example Picture above for Faculty='Humanities and Type='Kandidat', you can see that the values for the 6 universities in 2013 cumulates to 100% (KU=28%, AU=22%, AAU=12%, SDU=22%, CBS=7%, RUC=9%).
I want the chart to cumulate to 100% each year.
In your answer the percentages are to low. Maybe it's because the expression cumulates for all Years and not for each Year seperately.
Maybe the answer is a Manish expression, but I don't know what it is. I tried to google it, but didn't get anything. Do you know where I can find information on this?
Again thanks for all your help so far
Thanks
Bruno
- « Previous Replies
-
- 1
- 2
- Next Replies »