Unlock a world of possibilities! Login now and discover the exclusive benefits awaiting you.
- Qlik Community
- :
- All Forums
- :
- QlikView App Dev
- :
- Re: Problem with "Show Partial Sums"
- Subscribe to RSS Feed
- Mark Topic as New
- Mark Topic as Read
- Float this Topic for Current User
- Bookmark
- Subscribe
- Mute
- Printer Friendly Page
- Mark as New
- Bookmark
- Subscribe
- Mute
- Subscribe to RSS Feed
- Permalink
- Report Inappropriate Content
Problem with "Show Partial Sums"
I have the following table in QlikView
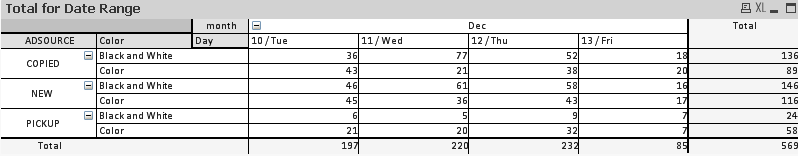
When I select "Show Partial Sum" the bottom row is giving the right results but the right column is not working property.
The expressions are calculated with this formula count({<event_date={">=$(=date(today() - 7))"} >} distinct element)
I am assuming that QlikView is having some issues with the count and the distinct and it is not displaying the right result on the total.
Can someone help?
- Tags:
- new_to_qlikview
- Mark as New
- Bookmark
- Subscribe
- Mute
- Subscribe to RSS Feed
- Permalink
- Report Inappropriate Content
Hi Marco,
When using the Distinct Count not show sum of all values, because Pivot table uses Expression total, i.e., it gets the overall Distinct count irrespective of Dimensions, where as for dimension values it is calculated at Dimension level. If you want both values same then convert this chart to Straight table and select Sum of Rows option in Expressions tab.
For example
Year ID
2012 1
2012 2
2013 2
When you get the count by Year level you will get Distinct ID for 2012 as and 2013 as 1 (2 + 1 = 3) and if you get overall then the distinct count is 2.
If you want to override this then use the following expression
=If(RowNo() = 0, Sum(Aggr(count({<event_date={">=$(=date(today() - 7))"} >} distinct element), ADSource, Color, month, Day)), count({<event_date={">=$(=date(today() - 7))"} >} distinct element))
Hope this helps you.
Regards,
Jagan.
- Mark as New
- Bookmark
- Subscribe
- Mute
- Subscribe to RSS Feed
- Permalink
- Report Inappropriate Content
Thank you. It confirmed what I thought.
At the end we decided not to change the chart type nor making any modifications.
I also tried your expression but for some reason did not work.
- Mark as New
- Bookmark
- Subscribe
- Mute
- Subscribe to RSS Feed
- Permalink
- Report Inappropriate Content
Hi Marco,
You try above(Jagan Saying) formula it's working fine...