Unlock a world of possibilities! Login now and discover the exclusive benefits awaiting you.
- Qlik Community
- :
- All Forums
- :
- QlikView App Dev
- :
- Re: Production times visualisation / Visualisation...
- Subscribe to RSS Feed
- Mark Topic as New
- Mark Topic as Read
- Float this Topic for Current User
- Bookmark
- Subscribe
- Mute
- Printer Friendly Page
- Mark as New
- Bookmark
- Subscribe
- Mute
- Subscribe to RSS Feed
- Permalink
- Report Inappropriate Content
Production times visualisation [Solved] / Visualisation des temps de production [Résolu]
Hi all,
First, sorry for my english 
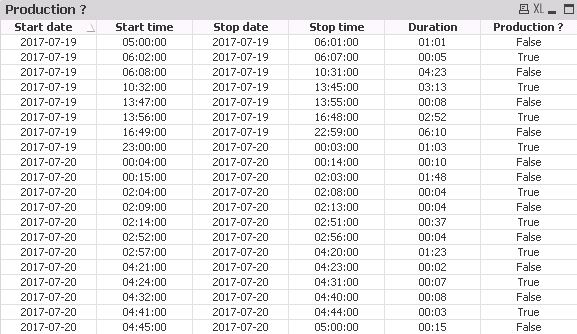
I have a table looking like this :
I just want to create a graph, per selected period, looking like this :
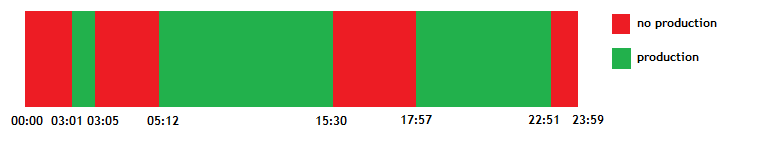
Looks simple but i'm not able to find the solution...
Thanks in advance for your help !
Guillaume
______________________________
En français rapidemment...
J'aimerai transformer le premier tableau en graphique juste en dessous
Merci d'avance pour votre aide !!
Guillaume
Accepted Solutions
- Mark as New
- Bookmark
- Subscribe
- Mute
- Subscribe to RSS Feed
- Permalink
- Report Inappropriate Content
Hi Guillaume,
Don't apologise for your English, I'm sure it's much better than my French!
Try this:
Data:
LOAD
*,
Num(Floor([Start date])) + Num([Start time]) as Start,
Num(Floor([Stop date])) + Num([Stop time]) as Stop;
LOAD [Start date],
Time([Start time]) as [Start time],
[Stop date],
Time([Stop time]) as [Stop time],
Production
FROM
Book1.xlsx
(ooxml, embedded labels, table is Sheet1);
Temp:
LOAD Min(Start) as StartPoint,Max(Stop) as StopPoint Resident Data;
Let vStart = Peek('StartPoint',0,'Temp');
Let vStop = Peek('StopPoint',0,'Temp');
DROP Table Temp;
Let NoOfMin = ($(vStop)-$(vStart))*24*60 +1;
[Master Clock]:
LOAD
Timestamp(Temp_Time) as [Clock Time];
LOAD
$(vStart) + (IterNo()-1)/24/60 as Temp_Time
AutoGenerate 1 While $(vStart) + (IterNo()-1)/24/60<= $(vStop);
IntervalMatch:
IntervalMatch( [Clock Time]) LOAD Start,Stop Resident Data;
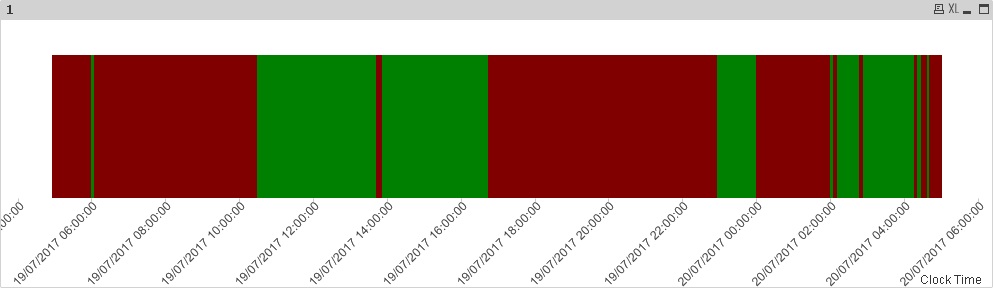
Now you can make this bar chart. dimension [Clock Time], expression:1
Background color : if(Production=1,Green(),Red())
Set the dimension axis to be continuous in the Axes tab.
Cheers
Andrew
- Mark as New
- Bookmark
- Subscribe
- Mute
- Subscribe to RSS Feed
- Permalink
- Report Inappropriate Content
Hi Guillaume,
Don't apologise for your English, I'm sure it's much better than my French!
Try this:
Data:
LOAD
*,
Num(Floor([Start date])) + Num([Start time]) as Start,
Num(Floor([Stop date])) + Num([Stop time]) as Stop;
LOAD [Start date],
Time([Start time]) as [Start time],
[Stop date],
Time([Stop time]) as [Stop time],
Production
FROM
Book1.xlsx
(ooxml, embedded labels, table is Sheet1);
Temp:
LOAD Min(Start) as StartPoint,Max(Stop) as StopPoint Resident Data;
Let vStart = Peek('StartPoint',0,'Temp');
Let vStop = Peek('StopPoint',0,'Temp');
DROP Table Temp;
Let NoOfMin = ($(vStop)-$(vStart))*24*60 +1;
[Master Clock]:
LOAD
Timestamp(Temp_Time) as [Clock Time];
LOAD
$(vStart) + (IterNo()-1)/24/60 as Temp_Time
AutoGenerate 1 While $(vStart) + (IterNo()-1)/24/60<= $(vStop);
IntervalMatch:
IntervalMatch( [Clock Time]) LOAD Start,Stop Resident Data;
Now you can make this bar chart. dimension [Clock Time], expression:1
Background color : if(Production=1,Green(),Red())
Set the dimension axis to be continuous in the Axes tab.
Cheers
Andrew
- Mark as New
- Bookmark
- Subscribe
- Mute
- Subscribe to RSS Feed
- Permalink
- Report Inappropriate Content
Hello Andrew,
Thanks for your answer !
I've got a "script error' anyway :
Script line error :
Let NoOfMin=(42938,208333333-42937.208333333)*24*60+1
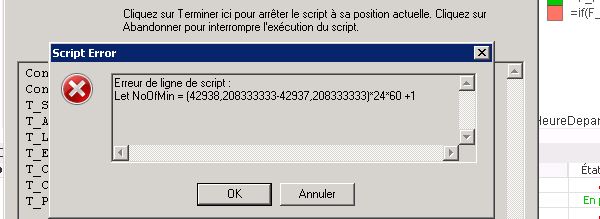
Any Idea... ?
Cheers
Guillaume
- Mark as New
- Bookmark
- Subscribe
- Mute
- Subscribe to RSS Feed
- Permalink
- Report Inappropriate Content
Hi Guillaume,
There seems to be an inconsistency in your timestamp formatting:
Let NoOfMin=(42938,208333333-42937.208333333)*24*60+1
42938,208333333 comma decimal separator
42937.208333333 period decimal separator
If you can iron that out it might work.
Cheers
Andrew
BTW I can't speak French but I like France and watched Truffaut's The 400 Blows (Les Quatre Cents Coups) on Saturday. What a great movie!!!
- Mark as New
- Bookmark
- Subscribe
- Mute
- Subscribe to RSS Feed
- Permalink
- Report Inappropriate Content
OK.
I think i undersood the trick.
I just "rounded" the value to have only "42938" and "42937".
And here it works.
Thank you so much for your help Andrew !
Wish you lot of good things
- Mark as New
- Bookmark
- Subscribe
- Mute
- Subscribe to RSS Feed
- Permalink
- Report Inappropriate Content
Thank you Guillaume!