Unlock a world of possibilities! Login now and discover the exclusive benefits awaiting you.
- Qlik Community
- :
- All Forums
- :
- QlikView App Dev
- :
- Re: Proportion at Subtotal Level
- Subscribe to RSS Feed
- Mark Topic as New
- Mark Topic as Read
- Float this Topic for Current User
- Bookmark
- Subscribe
- Mute
- Printer Friendly Page
- Mark as New
- Bookmark
- Subscribe
- Mute
- Subscribe to RSS Feed
- Permalink
- Report Inappropriate Content
Proportion at Subtotal Level
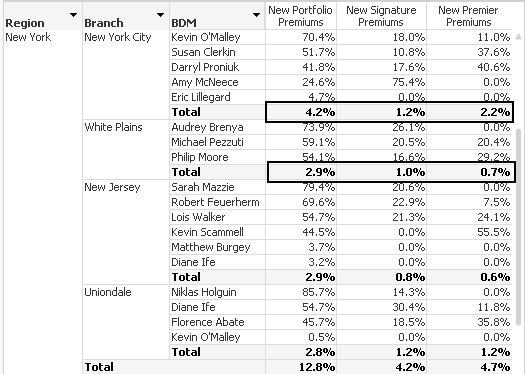
Hello, I have a Pivot Table chart object that looks like the picture below. I have three metrics that break the total by Segment. Here is the Set Analysis I have to calculate the proportion at the BDM level. My issue is that the Subtotals at the Branch/Region and overall total do not show the same sum to 100% as the BDM level. How would you accomplish that? Any help would be much appreciated.
Thanks,
Carl
sum({<YEAR={$(=max(YEAR))},SEGMENT={"Portfolio"}, [New HH Count]={1}>}[Policy Total TPREM])
/
sum(total<BDM>{<YEAR={$(=max(YEAR))}, [New HH Count]={1}>}[Policy Total TPREM])
Accepted Solutions
- Mark as New
- Bookmark
- Subscribe
- Mute
- Subscribe to RSS Feed
- Permalink
- Report Inappropriate Content
Oh I guess I've got it! Try to use "sum(total<Branch,BDM>" instead of "sum(total<BDM>".
- Mark as New
- Bookmark
- Subscribe
- Mute
- Subscribe to RSS Feed
- Permalink
- Report Inappropriate Content
I think you might have to use some form of How to use - Dimensionality() to get this working.... If you can share a sample... we might be able to have a look at this
- Mark as New
- Bookmark
- Subscribe
- Mute
- Subscribe to RSS Feed
- Permalink
- Report Inappropriate Content
Hello, Carl!
One of the most painless way is simply create a calculation within the script which will make additional rows for level BDM which will contain the aggr total sum. It's some kind of hand-made total =D .. Why not.
- Mark as New
- Bookmark
- Subscribe
- Mute
- Subscribe to RSS Feed
- Permalink
- Report Inappropriate Content
how would I "share a sample"?
- Mark as New
- Bookmark
- Subscribe
- Mute
- Subscribe to RSS Feed
- Permalink
- Report Inappropriate Content
do you have an example of how to do that in the script or point to a thread that references the idea?
- Mark as New
- Bookmark
- Subscribe
- Mute
- Subscribe to RSS Feed
- Permalink
- Report Inappropriate Content
Check these links out
Preparing examples for Upload - Reduction and Data Scrambling
- Mark as New
- Bookmark
- Subscribe
- Mute
- Subscribe to RSS Feed
- Permalink
- Report Inappropriate Content
Oh I guess I've got it! Try to use "sum(total<Branch,BDM>" instead of "sum(total<BDM>".
- Mark as New
- Bookmark
- Subscribe
- Mute
- Subscribe to RSS Feed
- Permalink
- Report Inappropriate Content
Rock on Sergey. The below returned what I needed. Thank you.
sum({<YEAR={$(=max(YEAR))},SEGMENT={"Portfolio"}, [New HH Count]={1}>}[Policy Total TPREM])
/
sum(total<Branch, BDM, Region>{<YEAR={$(=max(YEAR))}, [New HH Count]={1}>}[Policy Total TPREM])