Unlock a world of possibilities! Login now and discover the exclusive benefits awaiting you.
- Qlik Community
- :
- All Forums
- :
- QlikView App Dev
- :
- Re: QV - Chart Top 10 evolution (positive & negati...
Options
- Subscribe to RSS Feed
- Mark Topic as New
- Mark Topic as Read
- Float this Topic for Current User
- Bookmark
- Subscribe
- Mute
- Printer Friendly Page
Turn on suggestions
Auto-suggest helps you quickly narrow down your search results by suggesting possible matches as you type.
Showing results for
Creator
2018-01-11
05:43 AM
- Mark as New
- Bookmark
- Subscribe
- Mute
- Subscribe to RSS Feed
- Permalink
- Report Inappropriate Content
QV - Chart Top 10 evolution (positive & negative)
Hi,
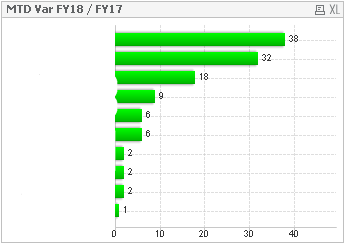
I would like to create a chart showing the top 10 evolution (positive & negative) by customers.
Here it is the Top 10 positive but how to include the negative value in the same chart ?
Many thanks

406 Views
3 Replies
2018-01-11
05:58 AM
- Mark as New
- Bookmark
- Subscribe
- Mute
- Subscribe to RSS Feed
- Permalink
- Report Inappropriate Content
Possible, Let me know how can we help you?
Best Anil, When applicable please mark the correct/appropriate replies as "solution" (you can mark up to 3 "solutions". Please LIKE threads if the provided solution is helpful
359 Views
Creator
2018-01-11
06:01 AM
Author
- Mark as New
- Bookmark
- Subscribe
- Mute
- Subscribe to RSS Feed
- Permalink
- Report Inappropriate Content
Many thanks for your answer but is there any chance you can provide some explanations ?
359 Views
2018-01-11
06:12 AM
- Mark as New
- Bookmark
- Subscribe
- Mute
- Subscribe to RSS Feed
- Permalink
- Report Inappropriate Content
Here are the approaches, I usually followed in measure
+ve -- SUM({<Name = {"=Rank(SUM(Amount))<=10"}>}Amount)
-ve -- SUM({<Name = {"=Rank(-SUM(Amount))<=10"}>}Amount)
Dimension level, It would be this?
+ve -- If(Aggr(Rank(SUM(Amount)), Name)<=10, Name)
-ve -- If(Aggr(Rank(-SUM(Amount)), Name)<=10, Name)
Best Anil, When applicable please mark the correct/appropriate replies as "solution" (you can mark up to 3 "solutions". Please LIKE threads if the provided solution is helpful
359 Views