Unlock a world of possibilities! Login now and discover the exclusive benefits awaiting you.
- Qlik Community
- :
- All Forums
- :
- QlikView App Dev
- :
- Re: QV graph problem....
- Subscribe to RSS Feed
- Mark Topic as New
- Mark Topic as Read
- Float this Topic for Current User
- Bookmark
- Subscribe
- Mute
- Printer Friendly Page
- Mark as New
- Bookmark
- Subscribe
- Mute
- Subscribe to RSS Feed
- Permalink
- Report Inappropriate Content
QV graph problem....

Hi all,
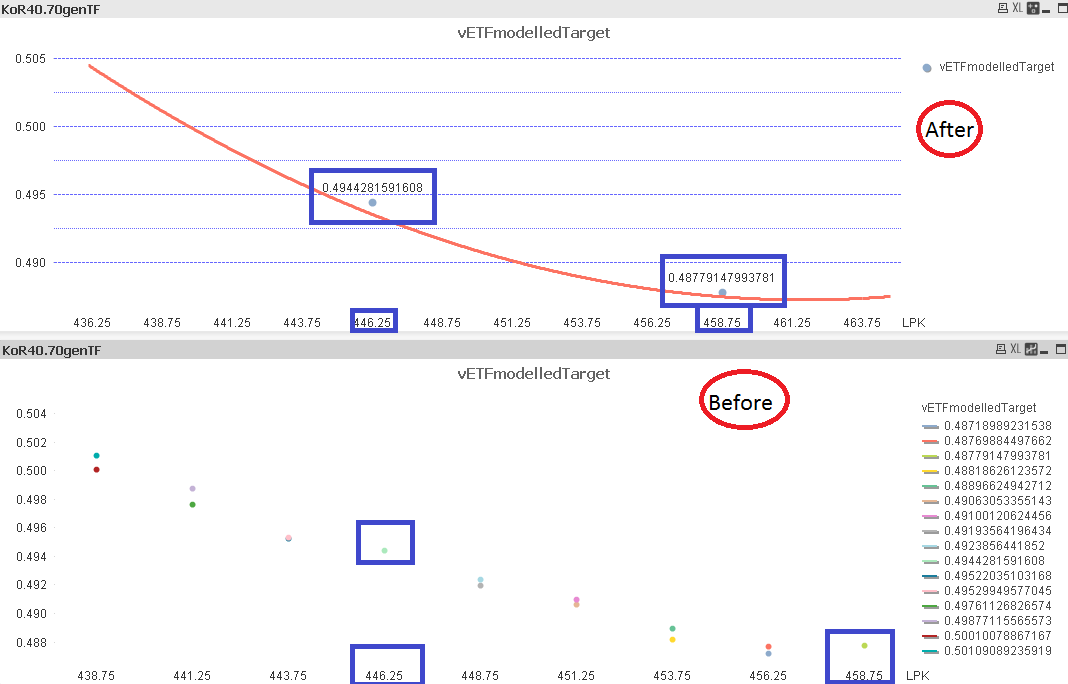
want to ask the picture above is my project now...and then i would like to add 1 trendline like the "After" graph as shown as above....now the problem is i want to show all the dots inside the graph but u all can see....at the "After" graph it jz show the 1 dots only....all the other consists multiple dots it will hide it....i want to ask any way or solution can hlp me to show all the dots in the graph with the trendline??
- Tags:
- new_to_qlikview
- Mark as New
- Bookmark
- Subscribe
- Mute
- Subscribe to RSS Feed
- Permalink
- Report Inappropriate Content
try to increase symbol size from presentation of chart properties.
might be value is less in comparision to previous values
hope this helps
- Mark as New
- Bookmark
- Subscribe
- Mute
- Subscribe to RSS Feed
- Permalink
- Report Inappropriate Content
erm....not the symbol problem...is the QV problem...it ignore it if the X-axis consists of more than 1 dots.....it only can shown if the X-axis value only hv 1 dot only......zzz
- Mark as New
- Bookmark
- Subscribe
- Mute
- Subscribe to RSS Feed
- Permalink
- Report Inappropriate Content
can you post the sample file
- Mark as New
- Bookmark
- Subscribe
- Mute
- Subscribe to RSS Feed
- Permalink
- Report Inappropriate Content
i can't share the sample file....sry about that.....
- Mark as New
- Bookmark
- Subscribe
- Mute
- Subscribe to RSS Feed
- Permalink
- Report Inappropriate Content
my problem now is missing some data points after i added the line into my chart.....any solution??