Unlock a world of possibilities! Login now and discover the exclusive benefits awaiting you.
- Qlik Community
- :
- All Forums
- :
- QlikView App Dev
- :
- Re: Qlik view - Column Accumulation
- Subscribe to RSS Feed
- Mark Topic as New
- Mark Topic as Read
- Float this Topic for Current User
- Bookmark
- Subscribe
- Mute
- Printer Friendly Page
- Mark as New
- Bookmark
- Subscribe
- Mute
- Subscribe to RSS Feed
- Permalink
- Report Inappropriate Content
Qlik view - Column Accumulation
Hi guys,
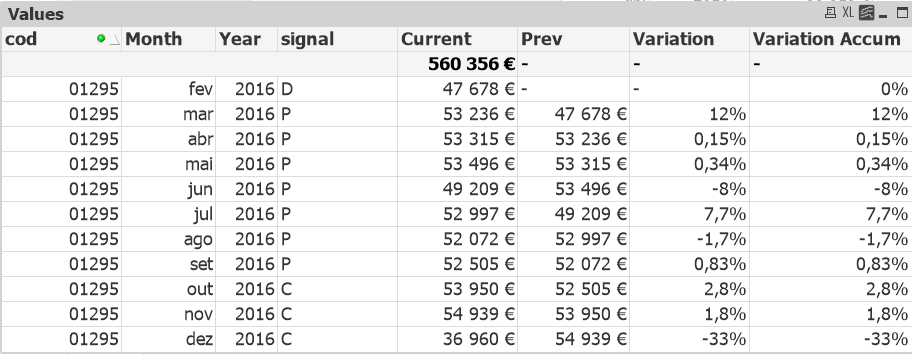
See the above image:

I want to create an accumulation of Column Variation in Column Variation Accum.
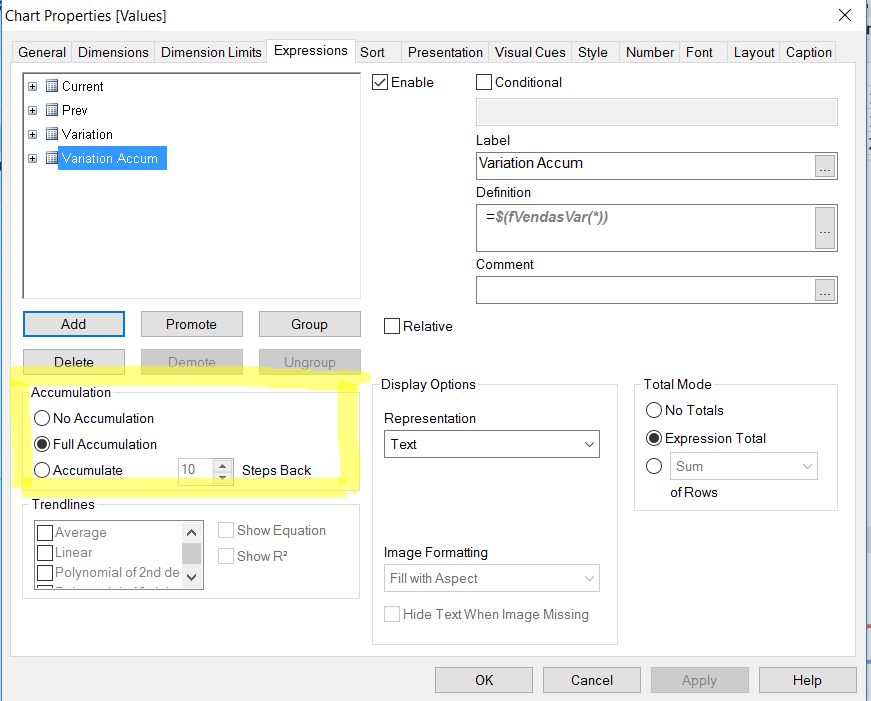
I'm using the same expression for both columns, but in the last one I'm using the "Full Accumulation" that qlikview has, but it's not working.

Can you pease help
Thanks in advance,
Sílvia
- « Previous Replies
-
- 1
- 2
- Next Replies »
- Mark as New
- Bookmark
- Subscribe
- Mute
- Subscribe to RSS Feed
- Permalink
- Report Inappropriate Content
Sunny, you're my HERO.
But, one more question ![]()
Now in graph 2, when a code is in the same month in the same FactFaseActive, it does not show in chart.
It's expected to show the average of value of the two (in this case) codes that exists in that month in the same FactFaseActive.
Any thougths?
Sílvia
- Mark as New
- Bookmark
- Subscribe
- Mute
- Subscribe to RSS Feed
- Permalink
- Report Inappropriate Content
What is the expression you are using for the second chart?
- Mark as New
- Bookmark
- Subscribe
- Mute
- Subscribe to RSS Feed
- Permalink
- Report Inappropriate Content
First I've used the same as the first graph.
But I think it should be this one:
Aggr(RangeSum(Above(TOTAL $(fVar(*)), 0, RowNo())), FactFaseActive, MonthYear)
Right?
Because now my dimension is FactFaseActive.
But using this, the values are wrong, in that specific months it keeps showing the same value.
- Mark as New
- Bookmark
- Subscribe
- Mute
- Subscribe to RSS Feed
- Permalink
- Report Inappropriate Content
Not sure, but may be this:
Avg(Aggr(RangeSum(Above(TOTAL $(fVar(*)), 0, RowNo())), Code, MonthYear))
- Mark as New
- Bookmark
- Subscribe
- Mute
- Subscribe to RSS Feed
- Permalink
- Report Inappropriate Content
Yes, that works Sunny ![]()
Do you have any documentation, that explains cases like this, or the use of this functions together?
- Mark as New
- Bookmark
- Subscribe
- Mute
- Subscribe to RSS Feed
- Permalink
- Report Inappropriate Content
Unfortunately, I don't have any holy grail I can share with you. Most of this is through trial and error over the last 2-3 years.
- Mark as New
- Bookmark
- Subscribe
- Mute
- Subscribe to RSS Feed
- Permalink
- Report Inappropriate Content
So 2 more years through trial end error for me ![]()
Thanks a lot for your help Sunny.
I'll buy you a cup of coffe when you come to Portugal ![]()
Best Regards,
Sílvia
- Mark as New
- Bookmark
- Subscribe
- Mute
- Subscribe to RSS Feed
- Permalink
- Report Inappropriate Content
Hahahaha sounds like a plan ![]()
- « Previous Replies
-
- 1
- 2
- Next Replies »