Unlock a world of possibilities! Login now and discover the exclusive benefits awaiting you.
- Qlik Community
- :
- All Forums
- :
- QlikView App Dev
- :
- Re: QlikView 11 Set Analysis disregards my selecti...
- Subscribe to RSS Feed
- Mark Topic as New
- Mark Topic as Read
- Float this Topic for Current User
- Bookmark
- Subscribe
- Mute
- Printer Friendly Page
- Mark as New
- Bookmark
- Subscribe
- Mute
- Subscribe to RSS Feed
- Permalink
- Report Inappropriate Content
QlikView 11 Set Analysis disregards my selection
Hi.
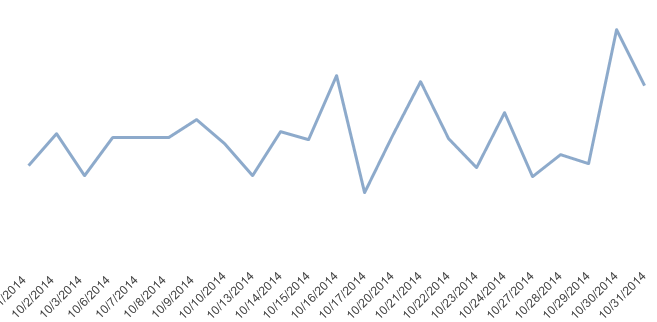
I am attempting to use Set Analysis to compare two data series over a certain time period. The first data series looks at all records in my data set over a certain month. I created a line chart where I look at that information and make the necessary date range selections in a multi-box. It looks like this:

Then I attempt to add the data series that I want to compare using set analysis I wanted to limit the data to a certain class so I used a formula similar to this:
sum({$<Class = {'Tier 1'}>} NumberIamMeasuring)
I was under the impression that the use of the "$" identifier would keep my current selections in tact. But when I do this my selections are disregarded and my chart turns into this:

I have been referencing the document I have attached and I can't seem to figure out what kind of mistake I am making.
Any help would be very appreciated.
Thanks.
- Mark as New
- Bookmark
- Subscribe
- Mute
- Subscribe to RSS Feed
- Permalink
- Report Inappropriate Content
Nathan,
Your SetAnalysis statement sets the Class to 'Tier 1' on top of the current selection state $.
$ - Represents the records of the current selection
If you would like to compare the first SUM(NumberIamMeasuring) with sum({$<Class = {'Tier 1'}>} NumberIamMeasuring) you'll have to create 2 expressions.
- Mark as New
- Bookmark
- Subscribe
- Mute
- Subscribe to RSS Feed
- Permalink
- Report Inappropriate Content
I'm sorry, I should have specified. I do have both expressions on there. It's just that after adding the second expression (the one with the set analysis), the chart changes and my date selections are ignored.
- Mark as New
- Bookmark
- Subscribe
- Mute
- Subscribe to RSS Feed
- Permalink
- Report Inappropriate Content
Based on your screenshots I can only see the difference in year.
Could you upload a small example app ?
- Mark as New
- Bookmark
- Subscribe
- Mute
- Subscribe to RSS Feed
- Permalink
- Report Inappropriate Content
I could work on setting up a small example app but it might take me a bit.
But the problem is the difference in the year. I need my month and day selections to stay the same when I apply that set analysis expression.
- Mark as New
- Bookmark
- Subscribe
- Mute
- Subscribe to RSS Feed
- Permalink
- Report Inappropriate Content
I looks like you have checked on "continuous" on the Axes tab? Does it work if you uncheck that?
-Rob
- Mark as New
- Bookmark
- Subscribe
- Mute
- Subscribe to RSS Feed
- Permalink
- Report Inappropriate Content
Unfortunately no. Continuous is actually not checked. I tried it again after checking and unchecking it and there were no changes.