Unlock a world of possibilities! Login now and discover the exclusive benefits awaiting you.
- Qlik Community
- :
- All Forums
- :
- QlikView App Dev
- :
- Re: QlikView - Keep all values in chart
- Subscribe to RSS Feed
- Mark Topic as New
- Mark Topic as Read
- Float this Topic for Current User
- Bookmark
- Subscribe
- Mute
- Printer Friendly Page
- Mark as New
- Bookmark
- Subscribe
- Mute
- Subscribe to RSS Feed
- Permalink
- Report Inappropriate Content
QlikView - Keep all values in chart
Hi,
Please see the attached app and Data files.
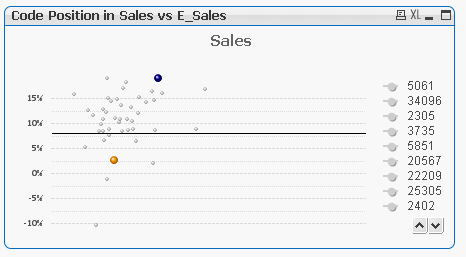
I want to analyse Sales vs E_Sales. (graph 1)
But I want that when I choose a Code it only shows the buble corresponding to that code in yellow, and keep the graph static.
I want to show all codes in graph. And when I choose, for example code = 11304, it shows that buble in yellow.
I also want to show the blue bubble which is my best in class for E_Sales.
In graph 2: Sales vs Sales, whenever I choose code, my graph doesn't change. It shows all values.
So, what I want is the same as in graph Sales vs Sales:
When no Code selected:
- show all bubles for all codes;
- show blue bubble, corresponding to best in class of E_Sales ( in graph 1) and Sales (in graph 2)
When Code 11304 selected:
- show all bubbles for all codes;
- show blue bubble, correspondig to best in class of E_Sales (in graph 1) and Sales (in graph 2)
- show yellow buble correspondig to 11304 (whic is the selected Code)
Thanks in advanced.
Sílvia
Accepted Solutions
- Mark as New
- Bookmark
- Subscribe
- Mute
- Subscribe to RSS Feed
- Permalink
- Report Inappropriate Content
Try this expression for E_Sales
If(
Above(Sum({<Code=, Active={"1"}, Year=, Month=, MonthYear=, Quarter=, Week=, DateNum={">=$(=Num(YearStart(Max({<Code=>}DateNum))))<=$(=Max({<Code=>}DateNum))"},
Metric={"E_Sales"}
>} Metric_Value),0,12)
/
Above(Sum({<Code=, Active={"1"}, Year=, Month=, MonthYear=, Quarter=, Week=, DateNum={">=$(=Num(YearStart(Max({<Code=>}DateNum))))<=$(=Max({<Code=>}DateNum))"},
Metric={"DM_Sales"}
>} Metric_Value),0,12)
< Sum(TOTAL {<Outlier_Name={"E_Sales"}>}Outlier_Value/100),
Num(Above(Sum({<Code=, Active={"1"}, Year=, Month=, MonthYear=, Quarter=, Week=, DateNum={">=$(=Num(YearStart(Max({<Code=>}DateNum))))<=$(=Max({<Code=>}DateNum))"},
Metric={"E_Sales"}
>} Metric_Value),0,12)
/
Above(Sum({<Code=, Active={"1"}, Year=, Month=, MonthYear=, Quarter=, Week=, DateNum={">=$(=Num(YearStart(Max({<Code=>}DateNum))))<=$(=Max({<Code=>}DateNum))"},
Metric={"DM_Sales"}
>} Metric_Value),0,12),'#0,0 %'))
- Mark as New
- Bookmark
- Subscribe
- Mute
- Subscribe to RSS Feed
- Permalink
- Report Inappropriate Content
So you are looking to make changes to both Chart1 and Chart2?
- Mark as New
- Bookmark
- Subscribe
- Mute
- Subscribe to RSS Feed
- Permalink
- Report Inappropriate Content
Hi Sunny,
No, only to chart 1.
Chart 2 seems to have the expected behavior.
- Mark as New
- Bookmark
- Subscribe
- Mute
- Subscribe to RSS Feed
- Permalink
- Report Inappropriate Content
Try this expression for E_Sales
If(
Above(Sum({<Code=, Active={"1"}, Year=, Month=, MonthYear=, Quarter=, Week=, DateNum={">=$(=Num(YearStart(Max({<Code=>}DateNum))))<=$(=Max({<Code=>}DateNum))"},
Metric={"E_Sales"}
>} Metric_Value),0,12)
/
Above(Sum({<Code=, Active={"1"}, Year=, Month=, MonthYear=, Quarter=, Week=, DateNum={">=$(=Num(YearStart(Max({<Code=>}DateNum))))<=$(=Max({<Code=>}DateNum))"},
Metric={"DM_Sales"}
>} Metric_Value),0,12)
< Sum(TOTAL {<Outlier_Name={"E_Sales"}>}Outlier_Value/100),
Num(Above(Sum({<Code=, Active={"1"}, Year=, Month=, MonthYear=, Quarter=, Week=, DateNum={">=$(=Num(YearStart(Max({<Code=>}DateNum))))<=$(=Max({<Code=>}DateNum))"},
Metric={"E_Sales"}
>} Metric_Value),0,12)
/
Above(Sum({<Code=, Active={"1"}, Year=, Month=, MonthYear=, Quarter=, Week=, DateNum={">=$(=Num(YearStart(Max({<Code=>}DateNum))))<=$(=Max({<Code=>}DateNum))"},
Metric={"DM_Sales"}
>} Metric_Value),0,12),'#0,0 %'))
- Mark as New
- Bookmark
- Subscribe
- Mute
- Subscribe to RSS Feed
- Permalink
- Report Inappropriate Content
Thanks Sunny, it works 
So, my problem was, the TOTAL in the if validation, and having the num format in the if validation too.
Guess I never thought about that.
Thanks again.
Regards,
Sílvia
- Mark as New
- Bookmark
- Subscribe
- Mute
- Subscribe to RSS Feed
- Permalink
- Report Inappropriate Content
Well, you can continue to have the Num... but it it is unnecessary because Num is just a formatting function, doesn't really do anything within the if statement....
But it seems like total did the trick.... why it doesn't work without the total... I am not sure