Unlock a world of possibilities! Login now and discover the exclusive benefits awaiting you.
- Qlik Community
- :
- All Forums
- :
- QlikView App Dev
- :
- Re: QlikView: Supress Zero Value in combination wi...
- Subscribe to RSS Feed
- Mark Topic as New
- Mark Topic as Read
- Float this Topic for Current User
- Bookmark
- Subscribe
- Mute
- Printer Friendly Page
- Mark as New
- Bookmark
- Subscribe
- Mute
- Subscribe to RSS Feed
- Permalink
- Report Inappropriate Content
QlikView: Supress Zero Value in combination with above()
Hello, just a very simple example:
tab:
LOAD * INLINE [
Year, Value
2013, 10
2014, 20
2015, 30
2016, 40
];
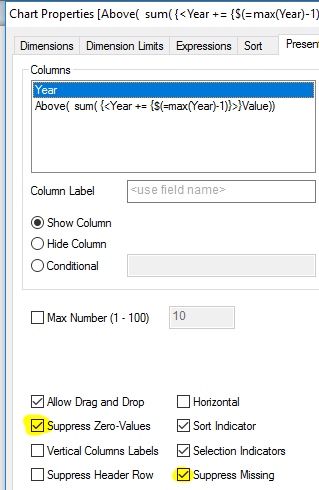
I created a chart with dimension Year and the following expression:
Above( sum( {<Year += {$(=max(Year)-1)}>}Value))
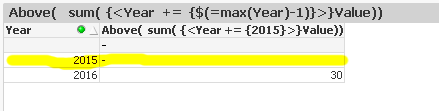
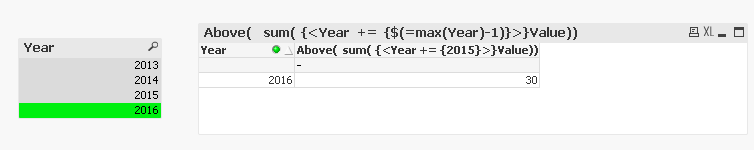
Now I select a Year:

I don't understand why the marked line is still visibile?!?
Accepted Solutions
- Mark as New
- Bookmark
- Subscribe
- Mute
- Subscribe to RSS Feed
- Permalink
- Report Inappropriate Content
I am not seeing it in the file you attached as well
What version of QV12 are you using? I am using QV12 SR5
- Mark as New
- Bookmark
- Subscribe
- Mute
- Subscribe to RSS Feed
- Permalink
- Report Inappropriate Content
I am not seeing the same issue as you
Do you still see that one row when you open the attached file?
- Mark as New
- Bookmark
- Subscribe
- Mute
- Subscribe to RSS Feed
- Permalink
- Report Inappropriate Content
I cant't test it now, because I have only QlikView 12 Personal Edition here.
For me it looks like a bug.
Please have a look at my attachment...
- Mark as New
- Bookmark
- Subscribe
- Mute
- Subscribe to RSS Feed
- Permalink
- Report Inappropriate Content
I am not seeing it in the file you attached as well
What version of QV12 are you using? I am using QV12 SR5
- Mark as New
- Bookmark
- Subscribe
- Mute
- Subscribe to RSS Feed
- Permalink
- Report Inappropriate Content
Maybe because '+' means
'using an implicit union to add the products “2015" to the list of selected products.'
- Mark as New
- Bookmark
- Subscribe
- Mute
- Subscribe to RSS Feed
- Permalink
- Report Inappropriate Content
Yes I thought something similar, that's why my question...
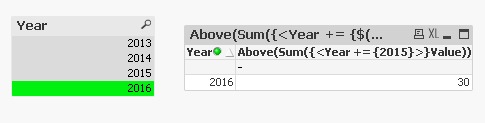
First I used QV12 SR1, now I updated to a newer version and it works as supossed.