Unlock a world of possibilities! Login now and discover the exclusive benefits awaiting you.
- Qlik Community
- :
- All Forums
- :
- QlikView App Dev
- :
- Qlikview Visualization
- Subscribe to RSS Feed
- Mark Topic as New
- Mark Topic as Read
- Float this Topic for Current User
- Bookmark
- Subscribe
- Mute
- Printer Friendly Page
- Mark as New
- Bookmark
- Subscribe
- Mute
- Subscribe to RSS Feed
- Permalink
- Report Inappropriate Content
Qlikview Visualization
Hi Guru's,
Is there any extension similar like word cloud ,I want to show top 10 customers names .I used word cloud but it is not looking good .
for best visualization please suggest me any good chart not regular use qlikview objects like bar , line etc......
Thanks,
Sateesh.T
- Mark as New
- Bookmark
- Subscribe
- Mute
- Subscribe to RSS Feed
- Permalink
- Report Inappropriate Content
These are basic requirements and you can implement it into any object....
Chart like bar is one of the best choice for this kind of analysis
http://www.learnqlickview.com/a-qlikview-tip-how-to-display-top-n-and-bottom-n-values/
- Mark as New
- Bookmark
- Subscribe
- Mute
- Subscribe to RSS Feed
- Permalink
- Report Inappropriate Content
PFA
Vikas
If the issue is solved please mark the answer with Accept as Solution & like it.
If you want to go quickly, go alone. If you want to go far, go together.
- Mark as New
- Bookmark
- Subscribe
- Mute
- Subscribe to RSS Feed
- Permalink
- Report Inappropriate Content
- Mark as New
- Bookmark
- Subscribe
- Mute
- Subscribe to RSS Feed
- Permalink
- Report Inappropriate Content
Hi,
Check this charts,
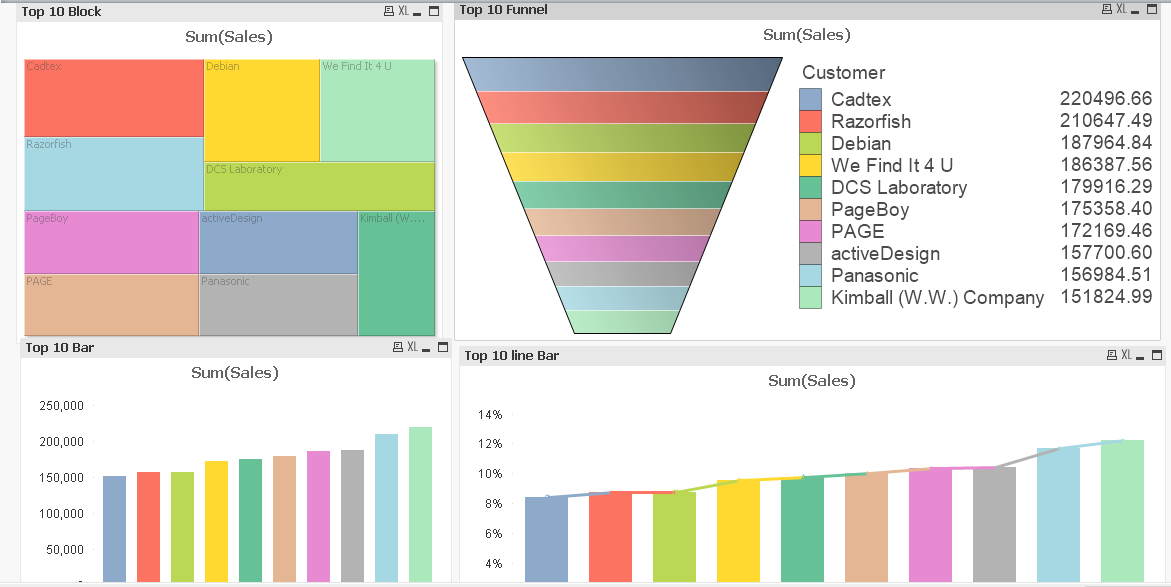
I think Funnel Chart Gives you a clear view of the Top - Down Customers with the Values too.
HTH,
PFA,
Hirish
- Mark as New
- Bookmark
- Subscribe
- Mute
- Subscribe to RSS Feed
- Permalink
- Report Inappropriate Content
Hi Sateesh,
pls check the below link
Word Cloud extension - top 10 words
How to create a Word Cloud ext
How can we create Word Cloud in Qlikview? - tools - Data Science, Analytics and Big Data discussions
If u r not interested with the result The best way is to create a Block/Mekko chart .
- Mark as New
- Bookmark
- Subscribe
- Mute
- Subscribe to RSS Feed
- Permalink
- Report Inappropriate Content
A word Cloud is not a good object to represent your top 10 customers as it does not directly display any quantitative measures.
As suggested by Balraj, a horizontal bar chart is a better solution as you can display the values on the bars and it clearly shows the quantitative difference between each customer.
People can differentiate between length far better than areas hence a bar chart is better than an area based object.
Also bar charts can display both positive and negative values, though hopefully your top 10 does not include negatives!