Unlock a world of possibilities! Login now and discover the exclusive benefits awaiting you.
- Qlik Community
- :
- All Forums
- :
- QlikView App Dev
- :
- Qlikview - timeline and places chart
- Subscribe to RSS Feed
- Mark Topic as New
- Mark Topic as Read
- Float this Topic for Current User
- Bookmark
- Subscribe
- Mute
- Printer Friendly Page
- Mark as New
- Bookmark
- Subscribe
- Mute
- Subscribe to RSS Feed
- Permalink
- Report Inappropriate Content
Qlikview - timeline and places chart
Hello,
I have a big problem with creating a timeline chart of my data (Trains).
I have this database:
| Key | Start_Place | End_Place | Start_Time | End_Time |
|---|---|---|---|---|
12345 | Munich | Cologne | 01.02.2017 05:00 | 01.02.2017 12:34 |
| 12345 | Cologne | Hamburg | 01.02.2017 14:00 | 01.02.2017 19:24 |
12345 | Hamburg | Berlin | 02.02.2017 04:01 | 02.02.2017 07:55 |
| 98765 | Paris | Cologne | 04.03.2017 07:33 | 04:03.2017 15:43 |
| 98765 | Cologne | Munich | 04.03.2017 16:00 | 04.03.2017 22:05 |
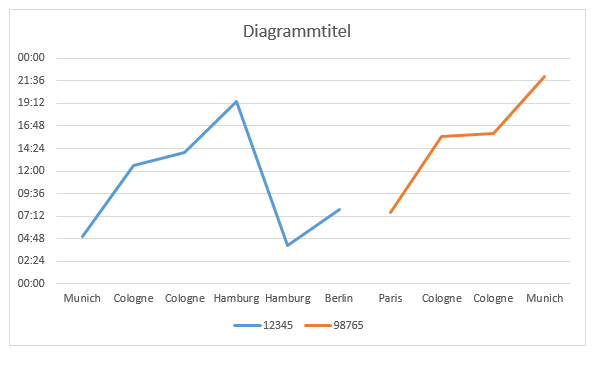
I want to have a linechart about the trains.
(When the trains is driving from one place to another and how long the train is at one place waiting)
I hope someone can help me! 
Thank you!
- « Previous Replies
-
- 1
- 2
- Next Replies »
- Mark as New
- Bookmark
- Subscribe
- Mute
- Subscribe to RSS Feed
- Permalink
- Report Inappropriate Content
How do you know that train wait time at one place?
- Mark as New
- Bookmark
- Subscribe
- Mute
- Subscribe to RSS Feed
- Permalink
- Report Inappropriate Content
Probably by matching the Start_Place to the End_Place of the previous leg and subtracting corresponding Start_Time from End_Time.
- Mark as New
- Bookmark
- Subscribe
- Mute
- Subscribe to RSS Feed
- Permalink
- Report Inappropriate Content
Can you show us an example of the line chart you want to obtain? Including dimensions?
You can do this in Excel with dummy data.
- Mark as New
- Bookmark
- Subscribe
- Mute
- Subscribe to RSS Feed
- Permalink
- Report Inappropriate Content
Yes i would do that.
But the big problem is linechart.
- Mark as New
- Bookmark
- Subscribe
- Mute
- Subscribe to RSS Feed
- Permalink
- Report Inappropriate Content
So I think you need to have End_Place as dimension, where train halts. Right?
- Mark as New
- Bookmark
- Subscribe
- Mute
- Subscribe to RSS Feed
- Permalink
- Report Inappropriate Content
And avg(Waiting_Time) as an expression? Sounds good. But a line chart?
- Mark as New
- Bookmark
- Subscribe
- Mute
- Subscribe to RSS Feed
- Permalink
- Report Inappropriate Content
Yes, this seems to be good as per the data and requirement.
- Mark as New
- Bookmark
- Subscribe
- Mute
- Subscribe to RSS Feed
- Permalink
- Report Inappropriate Content
Yes, something like this.
But it would be better if we change the Time/Place dimension.
So if the train is waiting there is a straight line and every place is only one time there.
- Mark as New
- Bookmark
- Subscribe
- Mute
- Subscribe to RSS Feed
- Permalink
- Report Inappropriate Content
Is there any way I can get a Chart like this?
I really need some help...
- « Previous Replies
-
- 1
- 2
- Next Replies »