Unlock a world of possibilities! Login now and discover the exclusive benefits awaiting you.
- Qlik Community
- :
- All Forums
- :
- QlikView App Dev
- :
- Re: QoQ Growth calculation using multiple dimensio...
- Subscribe to RSS Feed
- Mark Topic as New
- Mark Topic as Read
- Float this Topic for Current User
- Bookmark
- Subscribe
- Mute
- Printer Friendly Page
- Mark as New
- Bookmark
- Subscribe
- Mute
- Subscribe to RSS Feed
- Permalink
- Report Inappropriate Content
QoQ Growth calculation using multiple dimensions in StraightTable
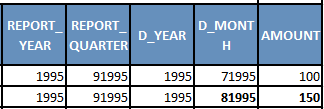
I have sample data associated as below.
| DIMENSIONS | EXPRESSION | |||||||||
DIV | FLAG | PARENT_GRP | CHILD_GRP | O_LOB | F_LOB | REPORT_YEAR | REPORT_QUARTER | D_YEAR | D_MONTH | AMOUNT |
|---|---|---|---|---|---|---|---|---|---|---|
| 10 | A | P1 | C1 | LOB1 | FLOB1 | 1995 | 091995 | 1995 | 071995 | 100 |
| 10 | A | P1 | C1 | LOB1 | FLOB1 | 1995 | 091995 | 1995 | 081995 | 150 |
| 10 | A | P1 | C1 | LOB1 | FLOB1 | 1995 | 121995 | 1995 | 071995 | 200 |
| 10 | A | P1 | C1 | LOB1 | FLOB1 | 1995 | 121995 | 1995 | 081995 | 100 |
| 10 | A | P1 | C1 | LOB1 | FLOB1 | 1996 | 031996 | 1995 | 071995 | 300 |
| 10 | A | P1 | C1 | LOB1 | FLOB1 | 1996 | 031996 | 1995 | 081995 | 350 |
| 10 | A | P1 | C1 | LOB1 | FLOB1 | 1996 | 061996 | 1995 | 081995 | 400 |
| 10 | A | P1 | C1 | LOB1 | FLOB1 | 1996 | 061996 | 1995 | 091995 | 450 |
| 10 | A | P1 | C1 | LOB1 | FLOB1 | 1996 | 061996 | 1995 | 111995 | 500 |
| 10 | A | P1 | C1 | LOB1 | FLOB1 | 1996 | 091996 | 1995 | 011995 | 550 |
| 10 | A | P1 | C1 | LOB1 | FLOB1 | 1996 | 091996 | 1995 | 061995 | 600 |
| 10 | A | P1 | C1 | LOB1 | FLOB1 | 1996 | 091996 | 1995 | 081995 | 650 |
| 10 | A | P1 | C1 | LOB1 | FLOB1 | 1996 | 091996 | 1995 | 091995 | 700 |
| 10 | A | P1 | C1 | LOB1 | FLOB1 | 1996 | 091996 | 1995 | 101995 | 750 |
| 10 | A | P1 | C1 | LOB1 | FLOB1 | 1996 | 091996 | 1995 | 111995 | 800 |
| 10 | A | P1 | C1 | LOB1 | FLOB1 | 1996 | 121996 | 1995 | 081995 | 500 |
| 10 | B | P1 | C2 | LOB1 | FLOB1 | 1995 | 031995 | 1995 | 011995 | 100 |
| 10 | B | P1 | C2 | LOB1 | FLOB1 | 1995 | 061995 | 1995 | 011995 | 200 |
| 10 | B | P1 | C2 | LOB1 | FLOB1 | 1996 | 091996 | 1995 | 011995 | 200 |
| 20 | A | P2 | C1 | LOB1 | FLOB1 | 1996 | 121996 | 1995 | 081995 | 100 |
| 20 | A | P2 | C1 | LOB2 | FLOB2 | 1996 | 091996 | 1995 | 081995 | 300 |
| 20 | B | P2 | C1 | LOB3 | FLOB3 | 1996 | 121996 | 1995 | 091995 | 400 |
I want to calculate Quarterly growth AMOUNT for each quarter of 'REPORT_QUARTER' based on maximum of 'D_MONTH' for all years of 'REPORT_YEAR' based on dimensions DIV, FLAG, P_GRP, C_GRP, O_LOB, F_LOB, REPORT_YEAR, REPORT_QUARTER.
I want to display the result data in straight table as below for DIV=10, FLAG=A, P_GRP=P1, C_GRP=C1, O_LOB=LOB1, F_LOB=FLOB1 for all years. With below REPORT_YEAR, QUARTER multibox filter.
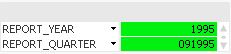
| Multibox Filter (For understdng, not to display in table) | Dimensions | Expression | Expression | |||||||||
REPORT_ YEAR | REPORT_ QUARTER | DIV | FLAG | P_GRP | C_GRP | O_LOB | F_LOB | D_YEAR | D_MONTH | AMOUNT | Quarterly GROWTH | Calculation for understanding |
|---|---|---|---|---|---|---|---|---|---|---|---|---|
| 1995 | 091995 | 10 | A | P1 | C1 | LOB1 | FLOB1 | 1995 | 071995 | 100 | - | |
| 1995 | 091995 | 10 | A | P1 | C1 | LOB1 | FLOB1 | 1995 | 081995 | 150 | - | |
| 1995 | 121995 | 10 | A | P1 | C1 | LOB1 | FLOB1 | 1995 | 071995 | 200 | - | |
| 1995 | 121995 | 10 | A | P1 | C1 | LOB1 | FLOB1 | 1995 | 081995 | 100 | -50 | (100-150) |
| 1996 | 031996 | 10 | A | P1 | C1 | LOB1 | FLOB1 | 1995 | 071995 | 300 | - | |
| 1996 | 031996 | 10 | A | P1 | C1 | LOB1 | FLOB1 | 1995 | 081995 | 350 | 250 | (350-100) |
| 1996 | 061996 | 10 | A | P1 | C1 | LOB1 | FLOB1 | 1995 | 081995 | 400 | - | |
| 1996 | 061996 | 10 | A | P1 | C1 | LOB1 | FLOB1 | 1995 | 091995 | 450 | - | |
| 1996 | 061996 | 10 | A | P1 | C1 | LOB1 | FLOB1 | 1995 | 111995 | 500 | 150 | (500-350) |
| 1996 | 091996 | 10 | A | P1 | C1 | LOB1 | FLOB1 | 1995 | 011995 | 550 | - | |
| 1996 | 091996 | 10 | A | P1 | C1 | LOB1 | FLOB1 | 1995 | 061995 | 600 | - | |
| 1996 | 091996 | 10 | A | P1 | C1 | LOB1 | FLOB1 | 1995 | 081995 | 650 | - | |
| 1996 | 091996 | 10 | A | P1 | C1 | LOB1 | FLOB1 | 1995 | 091995 | 700 | - | |
| 1996 | 091996 | 10 | A | P1 | C1 | LOB1 | FLOB1 | 1995 | 101995 | 750 | - | |
| 1996 | 091996 | 10 | A | P1 | C1 | LOB1 | FLOB1 | 1995 | 111995 | 800 | 300 | (800-500) |
| 1996 | 121996 | 10 | A | P1 | C1 | LOB1 | FLOB1 | 1995 | 081995 | 500 | -300 | (500-800) |
If user select year '1995', user should be able to see Quarterly GROWTH of -50 which is based on latest D_MONTH '081995' of REPORT_QUARTER's 091995 & 121995, likewise for other years.
Can anybody please help. Thanks in Advance. Thanks for your time.
Note: I cannot paste screenshot or developed application due to environment restrictions and confidentiality of data.
You can take the above table data as below.
Load *,MakeDate(Right(D_MONTH,4),left(D_MONTH,2)) as DATE;
LOAD DIV,
FLAG,
PARENT_GRP,
CHILD_GRP,
O_LOB,
F_LOB,
REPORT_YEAR,
REPORT_QUARTER,
D_YEAR,
D_MONTH,
AMOUNT
FROM
[https://community.qlik.com/thread/260354]
(html, codepage is 1252, embedded labels, table is @1, filters(
Remove(Row, Pos(Top, 19)),
Remove(Row, Pos(Top, 1))
Thanks,
Sri
- Mark as New
- Bookmark
- Subscribe
- Mute
- Subscribe to RSS Feed
- Permalink
- Report Inappropriate Content
Thank you very much. The solution is as expected.
If you dont mind, I have another query on the same set of data.
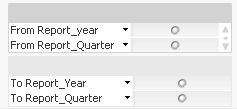
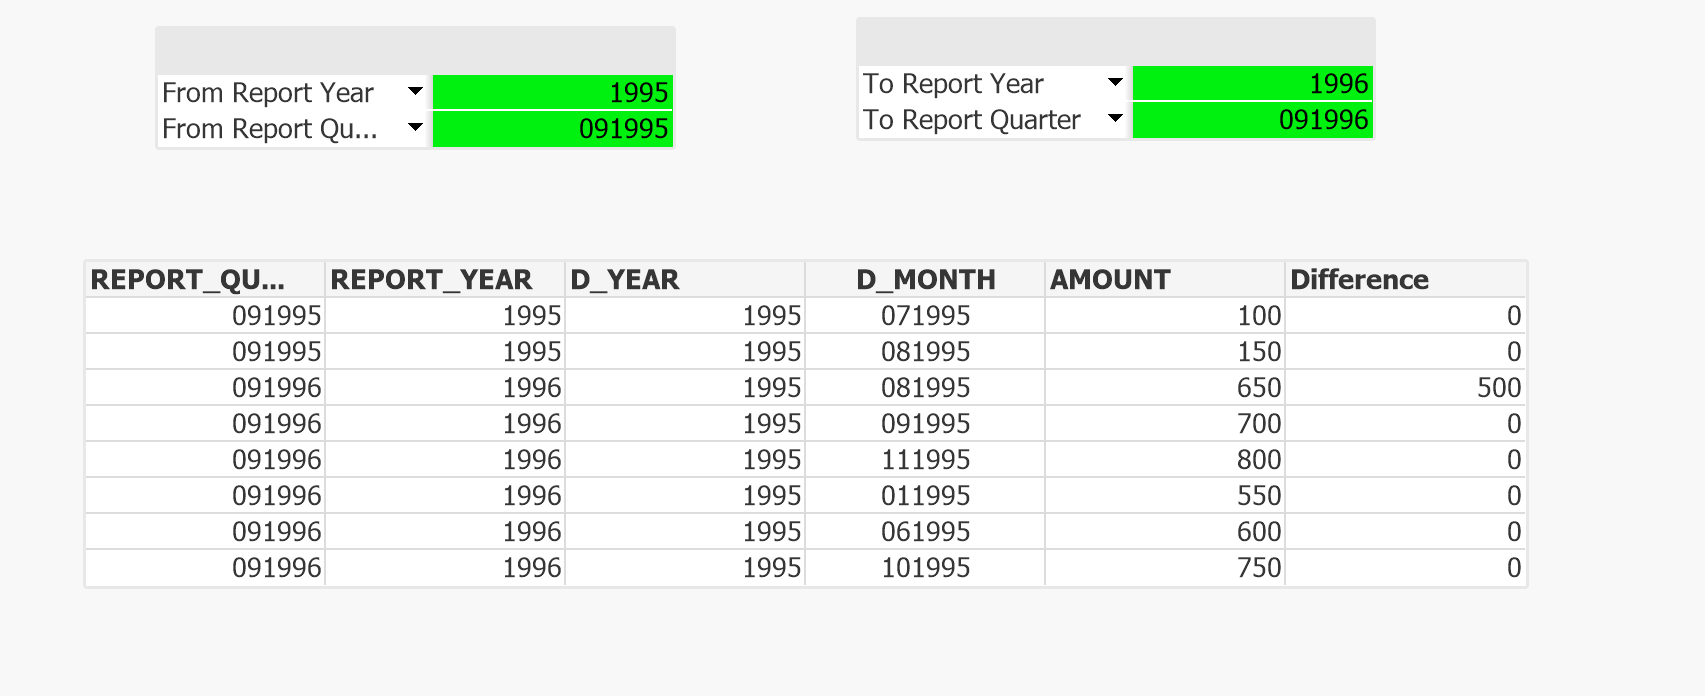
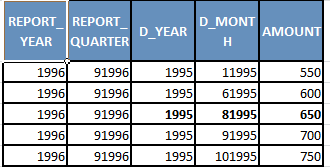
I have filters as above, My selections are
From_Report_year : 1995
From_Report_Qtr : 91995
To_Report_year : 1996
To_Report_Qtr : 91996
I want to Calculate Growth difference of only the matching D_MONTH values under the selected quarters. Here it is
650 (81995) - 150 (81995) = 500.
How I can implement this ? Is that I need to frame two master calendars on data ?
Can you please help me. Your thoughts and inputs are very much appreciated and helpful.
- Mark as New
- Bookmark
- Subscribe
- Mute
- Subscribe to RSS Feed
- Permalink
- Report Inappropriate Content
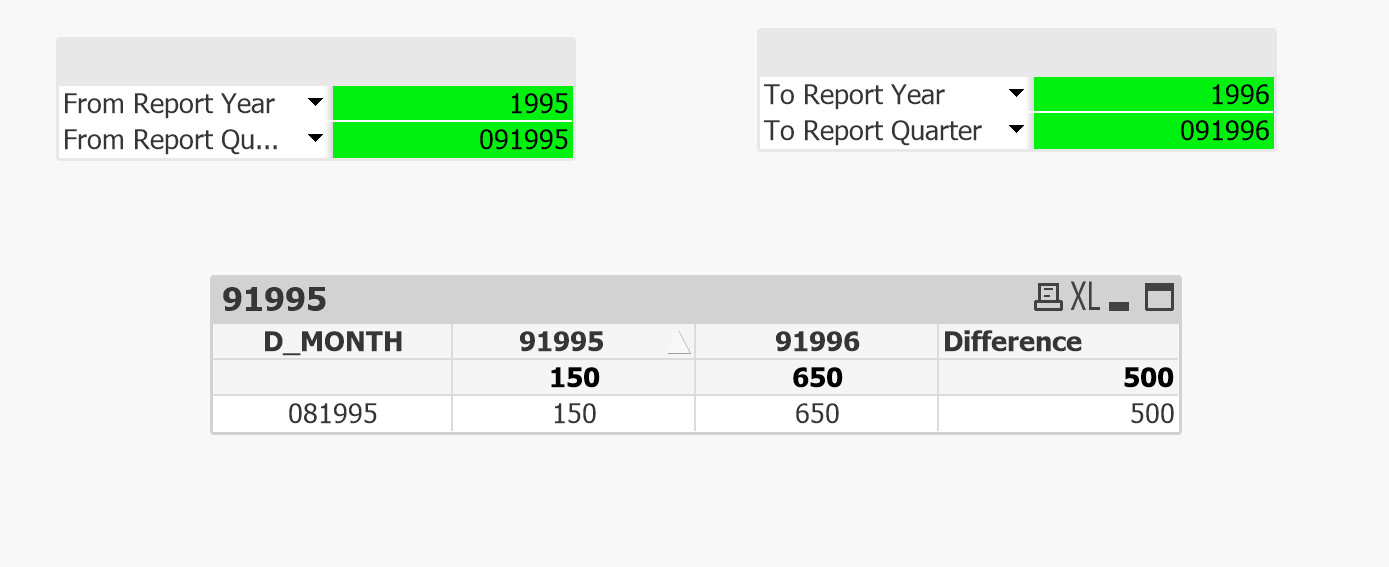
You can use alternate state to achieve this, see attached, you may need some changes to meet your specific requirements -
- Mark as New
- Bookmark
- Subscribe
- Mute
- Subscribe to RSS Feed
- Permalink
- Report Inappropriate Content
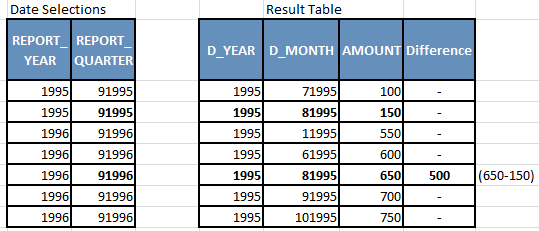
Thanks. I will check. but in addition to matching rows, I also need to show un-matching rows(where the difference would be null).
So I think this might be achieved only at back end script.
For sample date selections, this should be the result table.
- Mark as New
- Bookmark
- Subscribe
- Mute
- Subscribe to RSS Feed
- Permalink
- Report Inappropriate Content
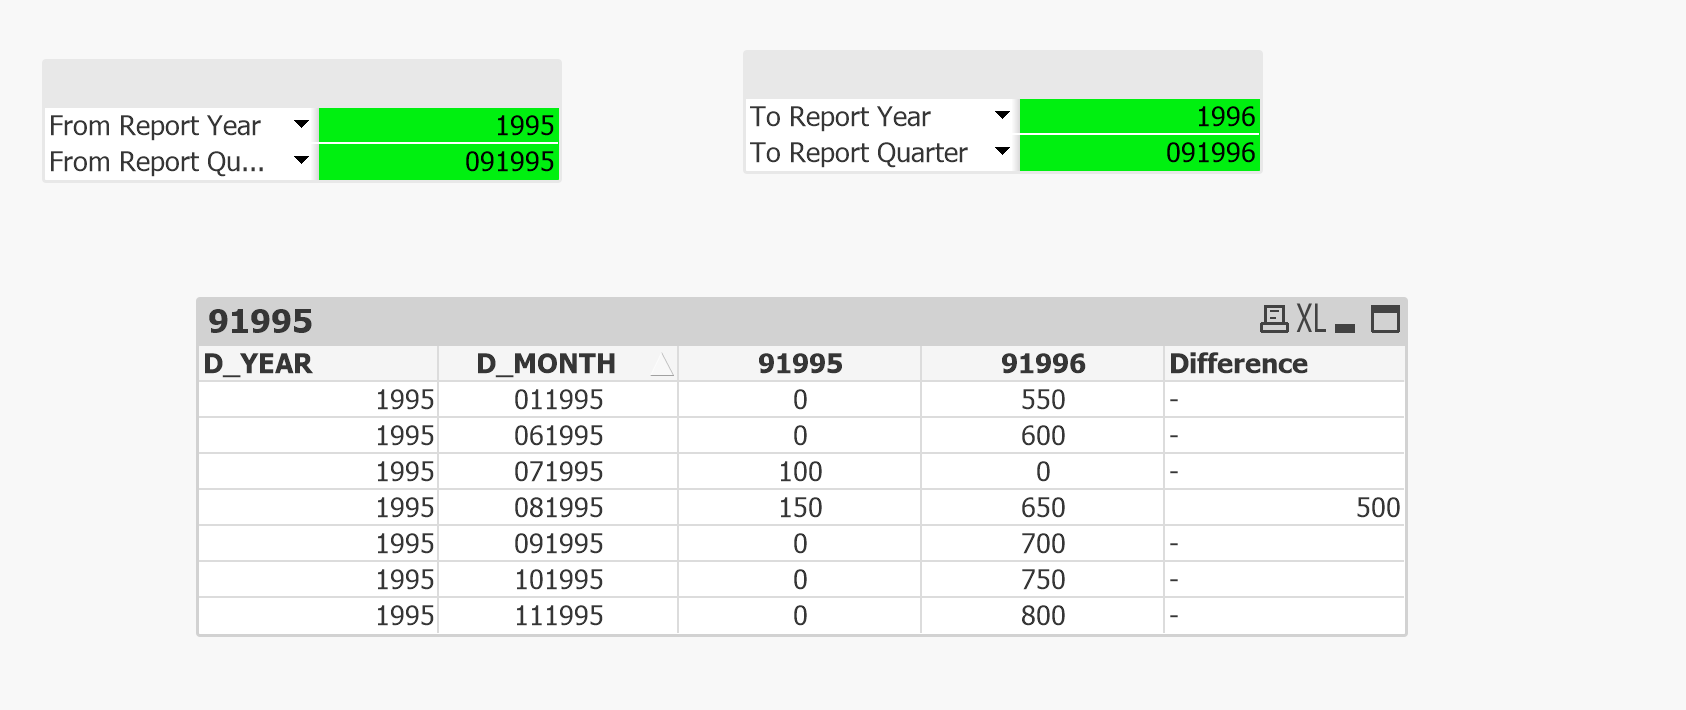
Check this -
- Mark as New
- Bookmark
- Subscribe
- Mute
- Subscribe to RSS Feed
- Permalink
- Report Inappropriate Content
'Difference' result calculations are coming correctly,
but I need to achieve the exact format of Result table(with columns D_YEAR,D_MONTH,AMOUNT,Difference).
Can this be achieved at backend script ? in any possible way ?
I tried assigning flags in script, but that didn't work for me.
- Mark as New
- Bookmark
- Subscribe
- Mute
- Subscribe to RSS Feed
- Permalink
- Report Inappropriate Content
Any possible way to achieve exact format of Result table(with columns D_YEAR,D_MONTH,AMOUNT,Difference). ?
using back end script ? Can you please help.
- Mark as New
- Bookmark
- Subscribe
- Mute
- Subscribe to RSS Feed
- Permalink
- Report Inappropriate Content
I think you don't need further work in script as required fields are already available to process what you need, let me try today sometime, was thinking of using addyear(Date,-1) to calculate the amount of last year for difference calculation.
- Mark as New
- Bookmark
- Subscribe
- Mute
- Subscribe to RSS Feed
- Permalink
- Report Inappropriate Content
ok. In sample data I have given two years for difference calculation. I have historical data (multiple years) where there is chance of comparing between 30-40 yrs.
since historical data is huge, I think front end logic will give performance issue, and looking for back end script logic.
- Mark as New
- Bookmark
- Subscribe
- Mute
- Subscribe to RSS Feed
- Permalink
- Report Inappropriate Content
Ok, make sense, will do something today on this.
- Mark as New
- Bookmark
- Subscribe
- Mute
- Subscribe to RSS Feed
- Permalink
- Report Inappropriate Content
I could manage to calculate difference in script, check below -