Unlock a world of possibilities! Login now and discover the exclusive benefits awaiting you.
- Qlik Community
- :
- All Forums
- :
- QlikView App Dev
- :
- Re: QoQ Growth calculation using multiple dimensio...
- Subscribe to RSS Feed
- Mark Topic as New
- Mark Topic as Read
- Float this Topic for Current User
- Bookmark
- Subscribe
- Mute
- Printer Friendly Page
- Mark as New
- Bookmark
- Subscribe
- Mute
- Subscribe to RSS Feed
- Permalink
- Report Inappropriate Content
QoQ Growth calculation using multiple dimensions in StraightTable
I have sample data associated as below.
| DIMENSIONS | EXPRESSION | |||||||||
DIV | FLAG | PARENT_GRP | CHILD_GRP | O_LOB | F_LOB | REPORT_YEAR | REPORT_QUARTER | D_YEAR | D_MONTH | AMOUNT |
|---|---|---|---|---|---|---|---|---|---|---|
| 10 | A | P1 | C1 | LOB1 | FLOB1 | 1995 | 091995 | 1995 | 071995 | 100 |
| 10 | A | P1 | C1 | LOB1 | FLOB1 | 1995 | 091995 | 1995 | 081995 | 150 |
| 10 | A | P1 | C1 | LOB1 | FLOB1 | 1995 | 121995 | 1995 | 071995 | 200 |
| 10 | A | P1 | C1 | LOB1 | FLOB1 | 1995 | 121995 | 1995 | 081995 | 100 |
| 10 | A | P1 | C1 | LOB1 | FLOB1 | 1996 | 031996 | 1995 | 071995 | 300 |
| 10 | A | P1 | C1 | LOB1 | FLOB1 | 1996 | 031996 | 1995 | 081995 | 350 |
| 10 | A | P1 | C1 | LOB1 | FLOB1 | 1996 | 061996 | 1995 | 081995 | 400 |
| 10 | A | P1 | C1 | LOB1 | FLOB1 | 1996 | 061996 | 1995 | 091995 | 450 |
| 10 | A | P1 | C1 | LOB1 | FLOB1 | 1996 | 061996 | 1995 | 111995 | 500 |
| 10 | A | P1 | C1 | LOB1 | FLOB1 | 1996 | 091996 | 1995 | 011995 | 550 |
| 10 | A | P1 | C1 | LOB1 | FLOB1 | 1996 | 091996 | 1995 | 061995 | 600 |
| 10 | A | P1 | C1 | LOB1 | FLOB1 | 1996 | 091996 | 1995 | 081995 | 650 |
| 10 | A | P1 | C1 | LOB1 | FLOB1 | 1996 | 091996 | 1995 | 091995 | 700 |
| 10 | A | P1 | C1 | LOB1 | FLOB1 | 1996 | 091996 | 1995 | 101995 | 750 |
| 10 | A | P1 | C1 | LOB1 | FLOB1 | 1996 | 091996 | 1995 | 111995 | 800 |
| 10 | A | P1 | C1 | LOB1 | FLOB1 | 1996 | 121996 | 1995 | 081995 | 500 |
| 10 | B | P1 | C2 | LOB1 | FLOB1 | 1995 | 031995 | 1995 | 011995 | 100 |
| 10 | B | P1 | C2 | LOB1 | FLOB1 | 1995 | 061995 | 1995 | 011995 | 200 |
| 10 | B | P1 | C2 | LOB1 | FLOB1 | 1996 | 091996 | 1995 | 011995 | 200 |
| 20 | A | P2 | C1 | LOB1 | FLOB1 | 1996 | 121996 | 1995 | 081995 | 100 |
| 20 | A | P2 | C1 | LOB2 | FLOB2 | 1996 | 091996 | 1995 | 081995 | 300 |
| 20 | B | P2 | C1 | LOB3 | FLOB3 | 1996 | 121996 | 1995 | 091995 | 400 |
I want to calculate Quarterly growth AMOUNT for each quarter of 'REPORT_QUARTER' based on maximum of 'D_MONTH' for all years of 'REPORT_YEAR' based on dimensions DIV, FLAG, P_GRP, C_GRP, O_LOB, F_LOB, REPORT_YEAR, REPORT_QUARTER.
I want to display the result data in straight table as below for DIV=10, FLAG=A, P_GRP=P1, C_GRP=C1, O_LOB=LOB1, F_LOB=FLOB1 for all years. With below REPORT_YEAR, QUARTER multibox filter.
| Multibox Filter (For understdng, not to display in table) | Dimensions | Expression | Expression | |||||||||
REPORT_ YEAR | REPORT_ QUARTER | DIV | FLAG | P_GRP | C_GRP | O_LOB | F_LOB | D_YEAR | D_MONTH | AMOUNT | Quarterly GROWTH | Calculation for understanding |
|---|---|---|---|---|---|---|---|---|---|---|---|---|
| 1995 | 091995 | 10 | A | P1 | C1 | LOB1 | FLOB1 | 1995 | 071995 | 100 | - | |
| 1995 | 091995 | 10 | A | P1 | C1 | LOB1 | FLOB1 | 1995 | 081995 | 150 | - | |
| 1995 | 121995 | 10 | A | P1 | C1 | LOB1 | FLOB1 | 1995 | 071995 | 200 | - | |
| 1995 | 121995 | 10 | A | P1 | C1 | LOB1 | FLOB1 | 1995 | 081995 | 100 | -50 | (100-150) |
| 1996 | 031996 | 10 | A | P1 | C1 | LOB1 | FLOB1 | 1995 | 071995 | 300 | - | |
| 1996 | 031996 | 10 | A | P1 | C1 | LOB1 | FLOB1 | 1995 | 081995 | 350 | 250 | (350-100) |
| 1996 | 061996 | 10 | A | P1 | C1 | LOB1 | FLOB1 | 1995 | 081995 | 400 | - | |
| 1996 | 061996 | 10 | A | P1 | C1 | LOB1 | FLOB1 | 1995 | 091995 | 450 | - | |
| 1996 | 061996 | 10 | A | P1 | C1 | LOB1 | FLOB1 | 1995 | 111995 | 500 | 150 | (500-350) |
| 1996 | 091996 | 10 | A | P1 | C1 | LOB1 | FLOB1 | 1995 | 011995 | 550 | - | |
| 1996 | 091996 | 10 | A | P1 | C1 | LOB1 | FLOB1 | 1995 | 061995 | 600 | - | |
| 1996 | 091996 | 10 | A | P1 | C1 | LOB1 | FLOB1 | 1995 | 081995 | 650 | - | |
| 1996 | 091996 | 10 | A | P1 | C1 | LOB1 | FLOB1 | 1995 | 091995 | 700 | - | |
| 1996 | 091996 | 10 | A | P1 | C1 | LOB1 | FLOB1 | 1995 | 101995 | 750 | - | |
| 1996 | 091996 | 10 | A | P1 | C1 | LOB1 | FLOB1 | 1995 | 111995 | 800 | 300 | (800-500) |
| 1996 | 121996 | 10 | A | P1 | C1 | LOB1 | FLOB1 | 1995 | 081995 | 500 | -300 | (500-800) |
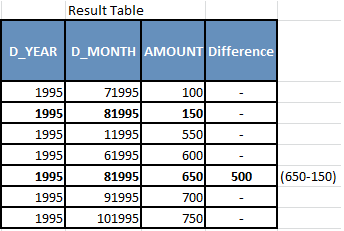
If user select year '1995', user should be able to see Quarterly GROWTH of -50 which is based on latest D_MONTH '081995' of REPORT_QUARTER's 091995 & 121995, likewise for other years.
Can anybody please help. Thanks in Advance. Thanks for your time.
Note: I cannot paste screenshot or developed application due to environment restrictions and confidentiality of data.
You can take the above table data as below.
Load *,MakeDate(Right(D_MONTH,4),left(D_MONTH,2)) as DATE;
LOAD DIV,
FLAG,
PARENT_GRP,
CHILD_GRP,
O_LOB,
F_LOB,
REPORT_YEAR,
REPORT_QUARTER,
D_YEAR,
D_MONTH,
AMOUNT
FROM
[https://community.qlik.com/thread/260354]
(html, codepage is 1252, embedded labels, table is @1, filters(
Remove(Row, Pos(Top, 19)),
Remove(Row, Pos(Top, 1))
Thanks,
Sri
- « Previous Replies
- Next Replies »
- Mark as New
- Bookmark
- Subscribe
- Mute
- Subscribe to RSS Feed
- Permalink
- Report Inappropriate Content
Script is working only for above selected From and to dates in screenshot. and not working for other combinations.
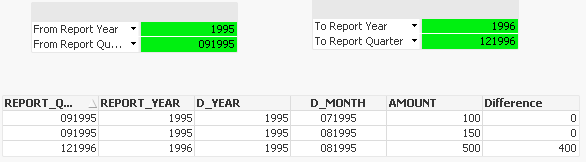
Also there is chance of comparing 1990 year financials with 1995 year and corresponding date financials (with Difference for only matching D_MONTH amounts) should be displayed. but this will work to compare current and previous years.
Historic data of 40 yrs.
Do qlikview will calculate the difference calculations on the fly based on filter selections, or The difference calculations should be calculated at backend first and displayed based on selections.
- Mark as New
- Bookmark
- Subscribe
- Mute
- Subscribe to RSS Feed
- Permalink
- Report Inappropriate Content
Earlier I was thinking your comparison is between consecutive years and it may involve 30-40 years but it looks like you are comparing two quarters only. You should go for front end solution. Its not possible to build script solution with any year quarter comparison with any other year quarter comparison.
- Mark as New
- Bookmark
- Subscribe
- Mute
- Subscribe to RSS Feed
- Permalink
- Report Inappropriate Content
Not possible is not right phrase, 'very complex' are the right words 
- Mark as New
- Bookmark
- Subscribe
- Mute
- Subscribe to RSS Feed
- Permalink
- Report Inappropriate Content
Thank you. If it can be achieved in build script solution (though very complex), what is the probable approach ? I used flags concept, it didn't work. Searched in community but haven't find any other way.
Will Quarter growth be achievable with any year quarter comparison with any other year quarter comparison using front end solution.
Our front end solution is giving result (I have to still test for multiple years though), but the display format should be changed. I have 5 more financials 'Amounts' to be displayed on same table.
Apologies if the discussion is going lengthy, I couldn't find a solution for my historic data.
- Mark as New
- Bookmark
- Subscribe
- Mute
- Subscribe to RSS Feed
- Permalink
- Report Inappropriate Content
The complexity I have in mind about script solution is storing comparison value of all months of all quarters of all years against all matching months of all quarters of all years. This is very tedious task, its like looping one month amount value against all other matching month values of all quarters of all years and store difference amount.
The good thing about front end solution is, you have already filtered the comparison period and its just a matter of putting values in the right format. It would have a near to same performance level as the scripting solution. Scripting solution might have impact on reload time, script maintenance, training etc kind of issues.
- Mark as New
- Bookmark
- Subscribe
- Mute
- Subscribe to RSS Feed
- Permalink
- Report Inappropriate Content
Does assigning flags for matching months of all quarters of all years will work with script solution ? I'm thinking of how to assign flags here. Any other approach do you think ?
Front end solution is working for few set of data and not working for other set of data. Can I find concrete solution if I go with front end scripting ?
Thanks for your time.
- « Previous Replies
- Next Replies »