Unlock a world of possibilities! Login now and discover the exclusive benefits awaiting you.
- Qlik Community
- :
- All Forums
- :
- QlikView App Dev
- :
- Re: RE:Selected values
- Subscribe to RSS Feed
- Mark Topic as New
- Mark Topic as Read
- Float this Topic for Current User
- Bookmark
- Subscribe
- Mute
- Printer Friendly Page
- Mark as New
- Bookmark
- Subscribe
- Mute
- Subscribe to RSS Feed
- Permalink
- Report Inappropriate Content
RE:Selected values
Hi all,
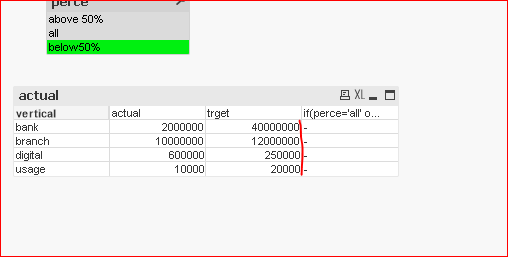
I have small pivot table table and one listbox so i want to show the data as per listbox values selection
Listboxvalues
Above50%
Below50%
All
so if i select any value that should be displayed as per selection.
Best
chanty
Accepted Solutions
- Mark as New
- Bookmark
- Subscribe
- Mute
- Subscribe to RSS Feed
- Permalink
- Report Inappropriate Content
Like this?
- Mark as New
- Bookmark
- Subscribe
- Mute
- Subscribe to RSS Feed
- Permalink
- Report Inappropriate Content
Hi Chanty 4u
I changed your script a bit and added a dual for your percentages.
Then I changed the dimensions using the dual with a pick statement
Does this help?
- Mark as New
- Bookmark
- Subscribe
- Mute
- Subscribe to RSS Feed
- Permalink
- Report Inappropriate Content
Chanty, might be ad hoc Reports
- Mark as New
- Bookmark
- Subscribe
- Mute
- Subscribe to RSS Feed
- Permalink
- Report Inappropriate Content
May be like in attached qvw.
- Mark as New
- Bookmark
- Subscribe
- Mute
- Subscribe to RSS Feed
- Permalink
- Report Inappropriate Content
Thanx.
But in your Qvw its not working for below 50%
- Mark as New
- Bookmark
- Subscribe
- Mute
- Subscribe to RSS Feed
- Permalink
- Report Inappropriate Content
Small correction. Try:
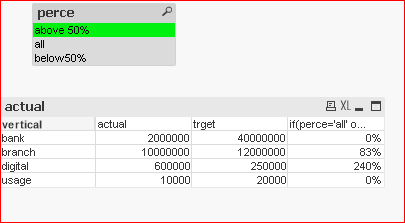
if(perce='all' or count(perce)>1,actual/trget,
If( Left(perce,5)='above', If(actual/trget>left(right(perce,3),2)/100, actual/trget,0),
if( Left(perce,5)='below', If(actual/trget<left(right(perce,3),2)/100,actual/trget,0))))
- Mark as New
- Bookmark
- Subscribe
- Mute
- Subscribe to RSS Feed
- Permalink
- Report Inappropriate Content
yeah.tresesco its still not working .As expected. And one more thing is i don't want extra column for this ?
how it is possible ?
it showing all values if i select in listbox .
- Mark as New
- Bookmark
- Subscribe
- Mute
- Subscribe to RSS Feed
- Permalink
- Report Inappropriate Content
Like this?