Unlock a world of possibilities! Login now and discover the exclusive benefits awaiting you.
- Qlik Community
- :
- All Forums
- :
- QlikView App Dev
- :
- Re: Rank Aggr issue (Top impact)
- Subscribe to RSS Feed
- Mark Topic as New
- Mark Topic as Read
- Float this Topic for Current User
- Bookmark
- Subscribe
- Mute
- Printer Friendly Page
- Mark as New
- Bookmark
- Subscribe
- Mute
- Subscribe to RSS Feed
- Permalink
- Report Inappropriate Content
Rank Aggr issue (Top impact)
Hi,
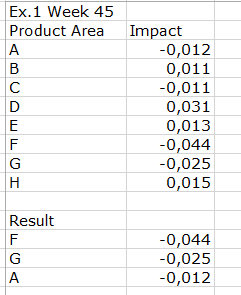
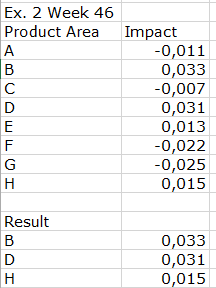
I'm in need of some help. I have a Straight table that shows Gross Margin impact this year compared to last in percent by product area. The Expression is a sum aggr on one dimension. My problem is that I want to show the top 3 Impact based on if the negative Impact is the biggest then I want the top 3 negative Impact to be shown and if the positive is the biggest I want the 3 top positive to show. Needs to be dynamical, the result can be different on different weeks. I tried the Rank function but haven’t got it to work. I past some example, How the table could look and what I want it to show.
Regards,
Ellinor
- Mark as New
- Bookmark
- Subscribe
- Mute
- Subscribe to RSS Feed
- Permalink
- Report Inappropriate Content
Perhaps this?
Sum({<[Product Area] = {"=Rank(Sum(Impact)) <= 3)"}, Week = {'$(=Max(Week))'}>} Impact)
- Mark as New
- Bookmark
- Subscribe
- Mute
- Subscribe to RSS Feed
- Permalink
- Report Inappropriate Content
My problem is that I want to show the top 3 Impact based on if the negative Impact is the biggest then I want the top 3 negative Impact to be shown and if the positive is the biggest I want the 3 top positive to show.
Based on the data you have provided, can you explain what do you mean by biggest negative and biggest positive impact here?
- Mark as New
- Bookmark
- Subscribe
- Mute
- Subscribe to RSS Feed
- Permalink
- Report Inappropriate Content
Here are two expressions based on my understanding of your requirement.... These will work when a week is selected
1) =If(Rank(Only(TOTAL Aggr(If(Rank(fabs(Impact)) = 1, Sign(Impact)), ProductArea))*Impact) < 4, Impact)
2) Only({<ProductArea = {"=Rank(Only(TOTAL Aggr(If(Rank(fabs(Impact)) = 1, Sign(Impact)), ProductArea))*Impact) < 4"}>}Impact)