Unlock a world of possibilities! Login now and discover the exclusive benefits awaiting you.
- Qlik Community
- :
- All Forums
- :
- QlikView App Dev
- :
- Rank Issues - Obtaining Rank non serially i.e thro...
- Subscribe to RSS Feed
- Mark Topic as New
- Mark Topic as Read
- Float this Topic for Current User
- Bookmark
- Subscribe
- Mute
- Printer Friendly Page
- Mark as New
- Bookmark
- Subscribe
- Mute
- Subscribe to RSS Feed
- Permalink
- Report Inappropriate Content
Rank Issues - Obtaining Rank non serially i.e through a set of columns and not
Hi,
Am a QV 10 user that likes to fiddle with developed docs to draw out data in different and more efficient ways.
Have come upon a stumbling block that is an impediment to a particular aspect of functionality we are are trying to implement through a set of reports.
Am illustrating my problem through images of the reports already in QV:
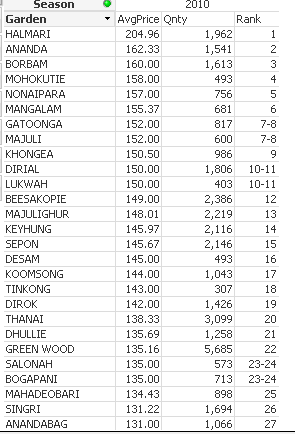
Report 1: - Rank is based on on Avg. Price and is being generated through a set of rows within one column. No problems with this report.

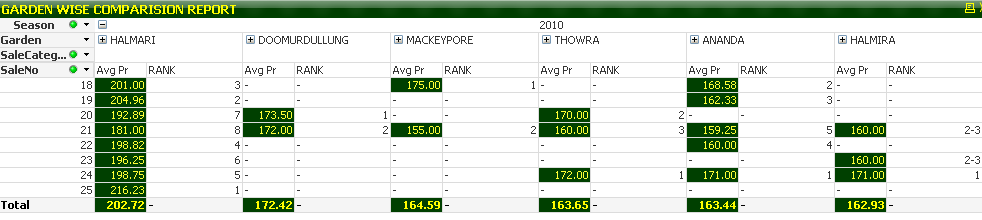
Report 2 A - A Similar report to report 1 but arranged differently. As is evident, the Gardens and Avg. Price are identical to the above report but the rank is being drawn out incorrectly. Require the same rank (based on Report 1) to feature in this report.

Report 2 B - An extension of Report 2 A which will illustrate further the depth of my problem

As is clear from the above report, rank is based on the average rank for each garden within a single column. We require rank to be generated for each garden for the average prices within each row, which in fact is nothing but report 1 transport into rows instead of a columnar format.
The code being used to generated rank currently (for all the displayed reports is):
//RANK( Total (SUM(If(Price>0,NETAMT))/ SUM(If(Price>0,Weight))), 99999)
RANK( Total If( SUM(If(Price>0,Weight))> AboveWeight, (SUM(If(Price>0,NETAMT))/ SUM(If(Price>0,Weight)))), 99999)
Have spent the greater part of the day trying to understand why this won't work - am sure its fairly simple. Would be extremely grateful for any solutions / feedback.
Regards,
Kanak Puri
- Tags:
- new_to_qlikview
- rank
- Mark as New
- Bookmark
- Subscribe
- Mute
- Subscribe to RSS Feed
- Permalink
- Report Inappropriate Content
- Mark as New
- Bookmark
- Subscribe
- Mute
- Subscribe to RSS Feed
- Permalink
- Report Inappropriate Content
Report 2 A