Unlock a world of possibilities! Login now and discover the exclusive benefits awaiting you.
- Qlik Community
- :
- All Forums
- :
- QlikView App Dev
- :
- Rank with/without Arrg - giving different result i...
- Subscribe to RSS Feed
- Mark Topic as New
- Mark Topic as Read
- Float this Topic for Current User
- Bookmark
- Subscribe
- Mute
- Printer Friendly Page
- Mark as New
- Bookmark
- Subscribe
- Mute
- Subscribe to RSS Feed
- Permalink
- Report Inappropriate Content
Rank with/without Arrg - giving different result in a textbox/straight table.
Hello,
I am having the problem with ranking.
I am try to display ranks on two places, in a straight table and in text box - but I receive different numbers of ranks here:
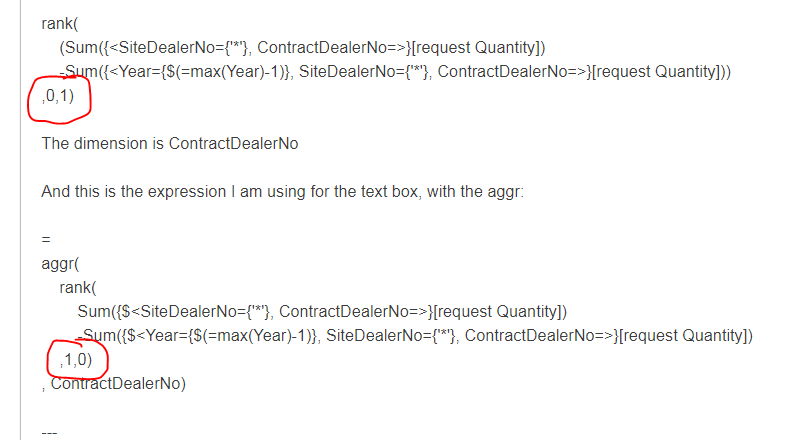
Here is the expression I am using for a chart:
rank(
(Sum({<SiteDealerNo={'*'}, ContractDealerNo=>}[request Quantity])
-Sum({<Year={$(=max(Year)-1)}, SiteDealerNo={'*'}, ContractDealerNo=>}[request Quantity]))
,0,1)
The dimension is ContractDealerNo
And this is the expression I am using for the text box, with the aggr:
=
aggr(
rank(
Sum({$<SiteDealerNo={'*'}, ContractDealerNo=>}[request Quantity])
-Sum({$<Year={$(=max(Year)-1)}, SiteDealerNo={'*'}, ContractDealerNo=>}[request Quantity])
,1,0)
, ContractDealerNo)
---
Now I tried to put both of them in a straight table - and I get different result for the contract:

Just One my discovery is, that I I don't use the subtraction of the last Year and Rank just this Year, it seems correct.
Does someone has any Ideas why is this different and how might I fix this?
Thank you.
- Mark as New
- Bookmark
- Subscribe
- Mute
- Subscribe to RSS Feed
- Permalink
- Report Inappropriate Content
The two expressions are slightly different (except for Aggr())
- Mark as New
- Bookmark
- Subscribe
- Mute
- Subscribe to RSS Feed
- Permalink
- Report Inappropriate Content
Nope, still the same.. I actual had it the same from start in the table.. I tried different rank parameters, all still gives same result.
- Mark as New
- Bookmark
- Subscribe
- Mute
- Subscribe to RSS Feed
- Permalink
- Report Inappropriate Content
Would you be able to add a sample to check this out?
- Mark as New
- Bookmark
- Subscribe
- Mute
- Subscribe to RSS Feed
- Permalink
- Report Inappropriate Content
Well, I found the culprit, which was the rounding. The round function with num helped. (So maybe for next generations).