Unlock a world of possibilities! Login now and discover the exclusive benefits awaiting you.
- Qlik Community
- :
- All Forums
- :
- QlikView App Dev
- :
- Ranking - Top 20 Next 20
- Subscribe to RSS Feed
- Mark Topic as New
- Mark Topic as Read
- Float this Topic for Current User
- Bookmark
- Subscribe
- Mute
- Printer Friendly Page
- Mark as New
- Bookmark
- Subscribe
- Mute
- Subscribe to RSS Feed
- Permalink
- Report Inappropriate Content
Ranking - Top 20 Next 20
Hi
I have written a Sales Rep report that emails out a Top 20 Sales People graph in N Printing - Known as Division 1 Sales.
I am now being asked to create a Division 2 Sales table, how in Qlik is it possible to create a table looking at the Ranked Sales 21 - 40
I assume that Ranking has something to do with it but not sure how to use this function.
Any help would be gratefully received.
Thanks
Dave
- « Previous Replies
- Next Replies »
Accepted Solutions
- Mark as New
- Bookmark
- Subscribe
- Mute
- Subscribe to RSS Feed
- Permalink
- Report Inappropriate Content
Regarding the performance I'd recommend using set analysis, you could try it with this expression:
SUM({<Employee = {"=Rank(SUM(Salary))>20"} * {"=Rank(SUM(Salary))<=40"}>}Salary)
Regards,
Patrick
Edit 19.09.17: as kush141087 mentioned, the intersection is not as performant as the "and" operator:
Therefore
SUM({<Employee = {"=Rank(SUM(Salary))>20 and Rank(SUM(Salary))<=40"}>}Salary)
should perform better
- Mark as New
- Bookmark
- Subscribe
- Mute
- Subscribe to RSS Feed
- Permalink
- Report Inappropriate Content
you can try expression something like
=if(rank(sum(Sales),0,1)>=21 and rank(sum(Sales),0,1)<= 40,sum(Sales))
- Mark as New
- Bookmark
- Subscribe
- Mute
- Subscribe to RSS Feed
- Permalink
- Report Inappropriate Content
Hi,
Try like this,
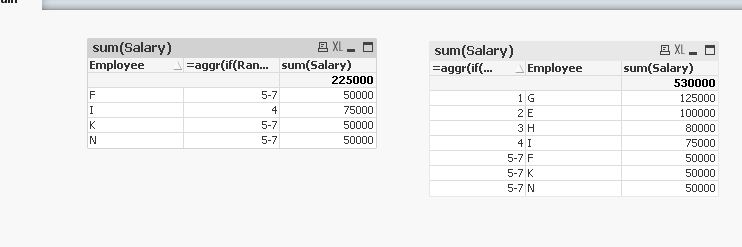
=aggr(if(Rank(sum(Salary))>=21 and Rank(sum(Salary))<=40,Rank(sum(Salary))),Employee)
- Mark as New
- Bookmark
- Subscribe
- Mute
- Subscribe to RSS Feed
- Permalink
- Report Inappropriate Content
If you have used a rank() in expression for creating the top 20 chart, the same expression could be modified for the 21-40 ranked sales. Say you have used expression something like:
=Sum({<SalesMan={"=Rank(Sum(Sales))<=20"}>}Sales)
for 21-40, modifiy it to something like:
=Sum({<SalesMan={"=Rank(Sum(Sales))>20 and Rank(Sum(Sales))<=40"}>}Sales)
- Mark as New
- Bookmark
- Subscribe
- Mute
- Subscribe to RSS Feed
- Permalink
- Report Inappropriate Content
Regarding the performance I'd recommend using set analysis, you could try it with this expression:
SUM({<Employee = {"=Rank(SUM(Salary))>20"} * {"=Rank(SUM(Salary))<=40"}>}Salary)
Regards,
Patrick
Edit 19.09.17: as kush141087 mentioned, the intersection is not as performant as the "and" operator:
Therefore
SUM({<Employee = {"=Rank(SUM(Salary))>20 and Rank(SUM(Salary))<=40"}>}Salary)
should perform better
- Mark as New
- Bookmark
- Subscribe
- Mute
- Subscribe to RSS Feed
- Permalink
- Report Inappropriate Content
As i know there is no function Rank() in script, But if really want to achieve then i would prefer like below
Fact:
LOAD * Inline [
Name, Sales
Rajendra, 10
Anil, 20
Weel, 30
];
Fact_Copy:
LOAD Name,
sum(Sales) as Total_Sales
Resident Fact
GROUP BY Name;
Fact_S_Copy:
LOAD Name,
RowNo() as Rank,
Total_Sales
RESIDENT Fact_Copy
ORDER BY Total_Sales asc;
DROP TABLE Fact_Copy;
Table:
LOAD Name,
Total_Sales,
if( Peek('Total_Sales') = Total_Sales, Peek('Dense_Rank'), Rank) as Dense_Rank
RESIDENT Fact_S_Copy
ORDER BY Total_Sales asc;
DROP TABLE Fact_S_Copy;
DROP Field Sales;
- Mark as New
- Bookmark
- Subscribe
- Mute
- Subscribe to RSS Feed
- Permalink
- Report Inappropriate Content
or better use set analysis
=sum({<SalesRep ={"=rank(sum(Sales),0,1)>=21 and rank(sum(Sales),0,1)<= 40"}>} Sales)
- Mark as New
- Bookmark
- Subscribe
- Mute
- Subscribe to RSS Feed
- Permalink
- Report Inappropriate Content
Isn't the problem in this case that you precalculate a rank which doesn't react to selections.
Therefore selecting a specific Product group wouldn't actually give the correct rank for this group but for the whole precalculation?
- Mark as New
- Bookmark
- Subscribe
- Mute
- Subscribe to RSS Feed
- Permalink
- Report Inappropriate Content
Hello Dave,
Have you checked and sure the expression provided by Patrick really works? You marked it correct, however, the expression looks not correct to me.
- Mark as New
- Bookmark
- Subscribe
- Mute
- Subscribe to RSS Feed
- Permalink
- Report Inappropriate Content
I thought, I've replied for this..
I am now being asked to create a Division 2 Sales table, how in Qlik is it possible to create a table looking at the Ranked Sales 21 - 40
- « Previous Replies
- Next Replies »