Unlock a world of possibilities! Login now and discover the exclusive benefits awaiting you.
- Qlik Community
- :
- All Forums
- :
- QlikView App Dev
- :
- Ratio of month sales between 2 years
- Subscribe to RSS Feed
- Mark Topic as New
- Mark Topic as Read
- Float this Topic for Current User
- Bookmark
- Subscribe
- Mute
- Printer Friendly Page
- Mark as New
- Bookmark
- Subscribe
- Mute
- Subscribe to RSS Feed
- Permalink
- Report Inappropriate Content
Ratio of month sales between 2 years
Hello,
I have a bar chart with the expresion: Sum(PNC). PNC is the sales. So I am trying to make a ratio of the (2016 sales - 2015 sales/ 2015 sales) and show it above the bars. But I have a problem with the ratio.
Clarifying a little bit, these whole data comes from a car dealer list of sales.
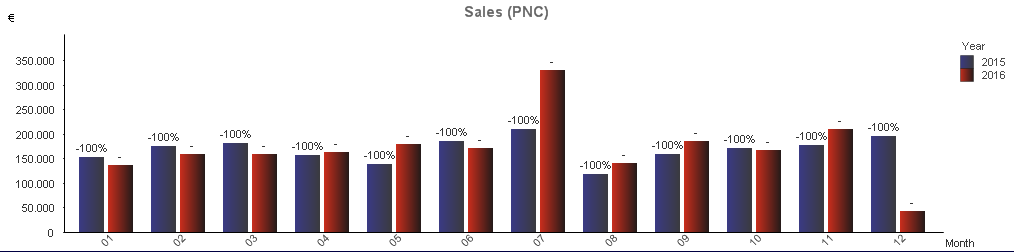
My expression for the rate is the following: num((sum({$<Year={2016}>} PNC) - sum({$<Year={2015}>} PNC))/sum({$<Year={2015}>} PNC),'#,%').
Here I separate the expression in a table chart so see the problem:
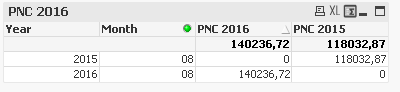
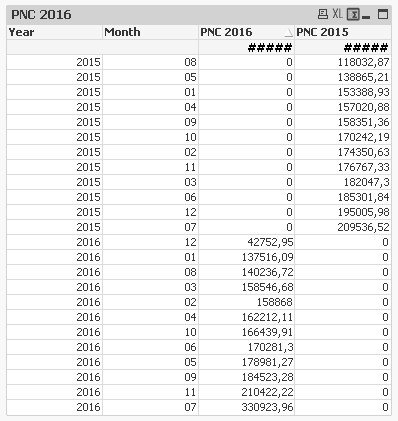
I noticed that in my expression I am comparing for the same year both values, so it does: 0-118032/118032 = -100% and 140236-0/0 = null instead of 140236-118032/118032 = 18,8%.
So how can I avoid the 0 value?
Thanks in advance.
Accepted Solutions
- Mark as New
- Bookmark
- Subscribe
- Mute
- Subscribe to RSS Feed
- Permalink
- Report Inappropriate Content
Thank you so much! I didnt know the function Aggr...
But in order to make it work I changed the order of the expression a little bit.
Num(
(Sum({<Year={2016}>} PNC) - above(Aggr(Sum({<Year={2015}>} PNC), Month, Year)))
/
above(Aggr(Sum({<Year={2015}>} PNC), Month, Year)),
'#,%')
BTW, do you know how can I remove the dash on the bars I dont use?
- Mark as New
- Bookmark
- Subscribe
- Mute
- Subscribe to RSS Feed
- Permalink
- Report Inappropriate Content
- Mark as New
- Bookmark
- Subscribe
- Mute
- Subscribe to RSS Feed
- Permalink
- Report Inappropriate Content
Thank you for your answer.
The above and below functions don't work. I think it's because this is a list that sums up a wider list of product sales. Then, when you use the above function you are displacing the values somewhere else.
And I don't know how the As-Of Table is goingto solve my problem.
- Mark as New
- Bookmark
- Subscribe
- Mute
- Subscribe to RSS Feed
- Permalink
- Report Inappropriate Content
Try this
Num(
(Sum({$<Year={2016}>} PNC) - Aggr(Above(Sum({$<Year={2015}>} PNC)), Month, Year))
/
Aggr(Above(Sum({$<Year={2015}>} PNC)), Month, Year),
'#,%')
- Mark as New
- Bookmark
- Subscribe
- Mute
- Subscribe to RSS Feed
- Permalink
- Report Inappropriate Content
Thank you so much! I didnt know the function Aggr...
But in order to make it work I changed the order of the expression a little bit.
Num(
(Sum({<Year={2016}>} PNC) - above(Aggr(Sum({<Year={2015}>} PNC), Month, Year)))
/
above(Aggr(Sum({<Year={2015}>} PNC), Month, Year)),
'#,%')
BTW, do you know how can I remove the dash on the bars I dont use?
- Mark as New
- Bookmark
- Subscribe
- Mute
- Subscribe to RSS Feed
- Permalink
- Report Inappropriate Content
Why do you even have a bar for 2015? What is it even showing?
- Mark as New
- Bookmark
- Subscribe
- Mute
- Subscribe to RSS Feed
- Permalink
- Report Inappropriate Content
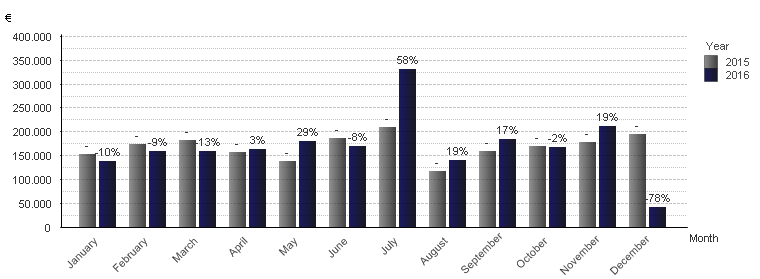
The bars are showing the expression: sum (sales) for 2015/2016 and the ratio is another expression (without bars) showing the difference between both years.
- Mark as New
- Bookmark
- Subscribe
- Mute
- Subscribe to RSS Feed
- Permalink
- Report Inappropriate Content
May be like this:
Alt(
Num(
(Sum({$<Year={2016}>} PNC) - Aggr(Above(Sum({$<Year={2015}>} PNC)), Month, Year))
/
Aggr(Above(Sum({$<Year={2015}>} PNC)), Month, Year),
'#,%'), ' ')
or
If(Len(Trim(
Num(
(Sum({$<Year={2016}>} PNC) - Aggr(Above(Sum({$<Year={2015}>} PNC)), Month, Year))
/
Aggr(Above(Sum({$<Year={2015}>} PNC)), Month, Year),
'#,%'))) > 0,
Num(
(Sum({$<Year={2016}>} PNC) - Aggr(Above(Sum({$<Year={2015}>} PNC)), Month, Year))
/
Aggr(Above(Sum({$<Year={2015}>} PNC)), Month, Year),
'#,%'), ' ')
- Mark as New
- Bookmark
- Subscribe
- Mute
- Subscribe to RSS Feed
- Permalink
- Report Inappropriate Content
Thanks again! The first one works perfectly.