Unlock a world of possibilities! Login now and discover the exclusive benefits awaiting you.
- Qlik Community
- :
- All Forums
- :
- QlikView App Dev
- :
- Re: Re: Re: funnel chart display values from diffe...
- Subscribe to RSS Feed
- Mark Topic as New
- Mark Topic as Read
- Float this Topic for Current User
- Bookmark
- Subscribe
- Mute
- Printer Friendly Page
- Mark as New
- Bookmark
- Subscribe
- Mute
- Subscribe to RSS Feed
- Permalink
- Report Inappropriate Content
Re: funnel chart display values from different expressions
hi, what i Need is to Show all values in every Level of the funnel. I did not use dimensions, only expressions, but i cannot Display the values there. I Need to Show two values per Level (absolut and percentage). I created four expressions.
any idea on how to do it?
thanks
felipe
- « Previous Replies
-
- 1
- 2
- Next Replies »
- Mark as New
- Bookmark
- Subscribe
- Mute
- Subscribe to RSS Feed
- Permalink
- Report Inappropriate Content
I just created a funnel and was able to show the values on data points for 3 separate expressions. Are you sure you cleared all selections when you're viewing this?
- Mark as New
- Bookmark
- Subscribe
- Mute
- Subscribe to RSS Feed
- Permalink
- Report Inappropriate Content
yes, i selected values on data Points and cleared all selections
Robert, do you have a Dimension in your funnel?
- Mark as New
- Bookmark
- Subscribe
- Mute
- Subscribe to RSS Feed
- Permalink
- Report Inappropriate Content
No, just the expressions
- Mark as New
- Bookmark
- Subscribe
- Mute
- Subscribe to RSS Feed
- Permalink
- Report Inappropriate Content
You must select : "Values on Data Points" for each expression in your chart. not just the first one.
- Mark as New
- Bookmark
- Subscribe
- Mute
- Subscribe to RSS Feed
- Permalink
- Report Inappropriate Content
mm, then is rare
Jacob, i selected "value on data Points" on all expressions
i probably Need to Change my table structures and set a dimension
Robert could you share with me your funnel Chart?
thanks
felipe
- Mark as New
- Bookmark
- Subscribe
- Mute
- Subscribe to RSS Feed
- Permalink
- Report Inappropriate Content
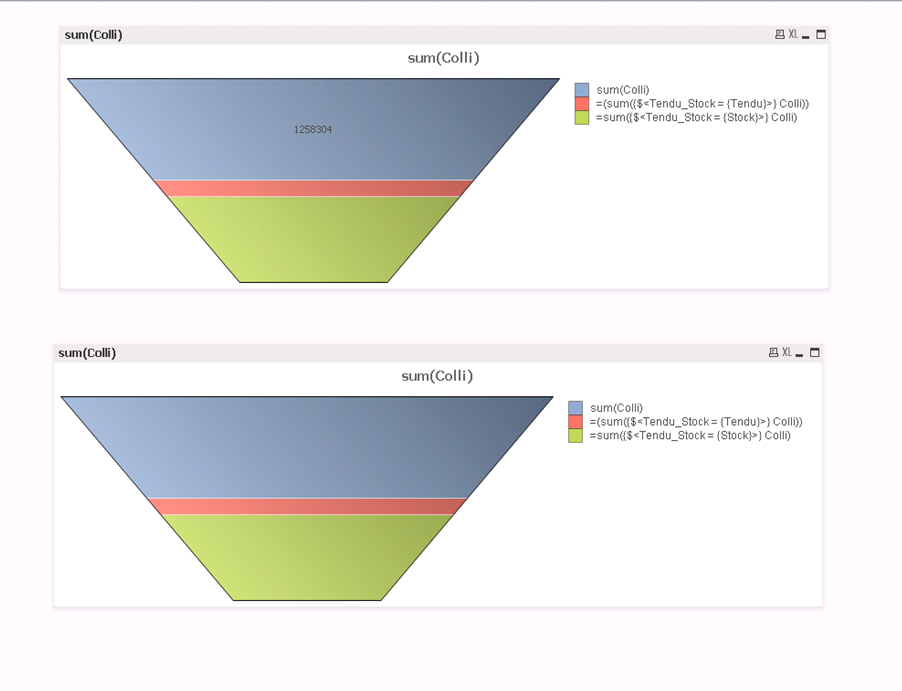
Apparently there is some sort of bug (i included a link to that discussion) that displays all values for values on data points in a funnel chart that shows cascading values, but I attached mine and you can see that you can get values for each expression. My recommendation would be to use a textbox with a transparent background.
Sorry bud
- Mark as New
- Bookmark
- Subscribe
- Mute
- Subscribe to RSS Feed
- Permalink
- Report Inappropriate Content
This shows the bugged solution at the top, and the bottom is the chart with the transparent text boxes
- Mark as New
- Bookmark
- Subscribe
- Mute
- Subscribe to RSS Feed
- Permalink
- Report Inappropriate Content
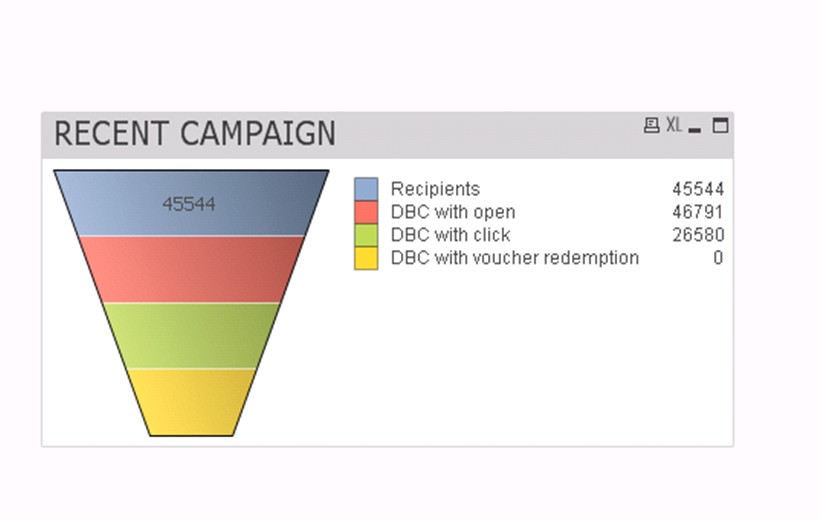
HI Robert
this is how I see your funnel on my QV Version 11.2 SR5. As in my case i just see the first value point
Probably i Need to use the text box, or Change the data structure, so that i have a Dimension to Display all values
thanks
felipe
- Mark as New
- Bookmark
- Subscribe
- Mute
- Subscribe to RSS Feed
- Permalink
- Report Inappropriate Content
it is possible to Display all Expression values on the Chart using QV 11.2 SR7 (11.20.12451)
my current Version is QV 11.2 SR5, and here it is not possible. Alternative it is possible to use text boxes or text in the presentation option
- « Previous Replies
-
- 1
- 2
- Next Replies »