Unlock a world of possibilities! Login now and discover the exclusive benefits awaiting you.
- Qlik Community
- :
- All Forums
- :
- QlikView App Dev
- :
- Reference line expression
- Subscribe to RSS Feed
- Mark Topic as New
- Mark Topic as Read
- Float this Topic for Current User
- Bookmark
- Subscribe
- Mute
- Printer Friendly Page
- Mark as New
- Bookmark
- Subscribe
- Mute
- Subscribe to RSS Feed
- Permalink
- Report Inappropriate Content
Reference line expression
Working on the following waterfall chart I am trying to create associated reference lines based upon the selection of a region and date and have it display the corresponding budget target.
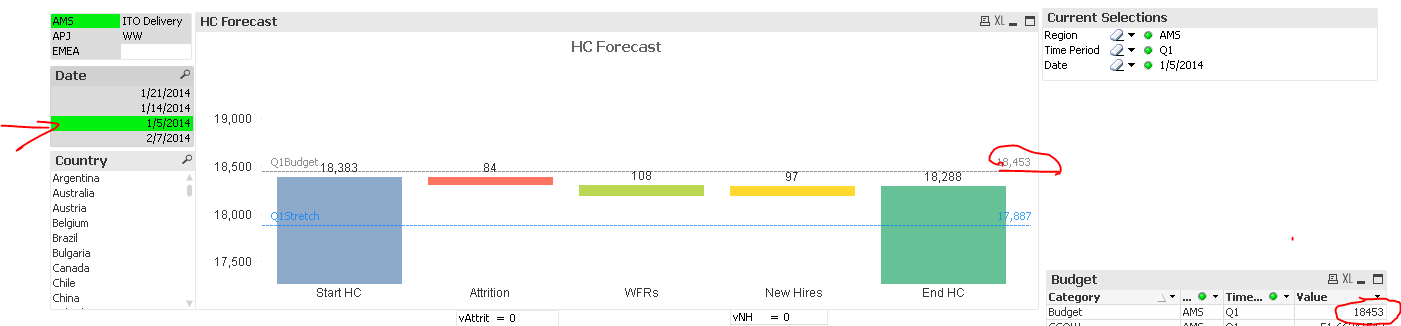
A kind member of the community provided me with the following which works great to display for those dates within Q1
=if(Count(DISTINCT Region) = 1 AND count(DISTINCT [Time Period])=1,sum({<Category={Budget}>}Value),'')
However once I select a time period outside of the first quarter it will not display
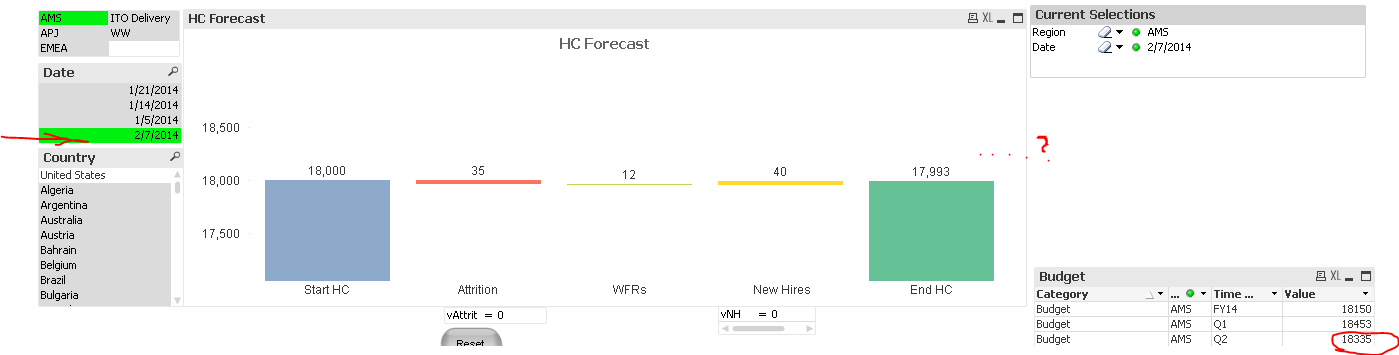
So the question is, how can I modify the above such that it will recognize when the date selected corresponds to a new quarter? (Our quarters are Nov-Jan Q1, Feb-Apr q2, etc).
I feel like I need to provide some type of lookup reference against the month to determine the right quarter but I am not familiar enough with QV yet to know quite how. Any help would be most appreciated.
- Mark as New
- Bookmark
- Subscribe
- Mute
- Subscribe to RSS Feed
- Permalink
- Report Inappropriate Content
Hi.
What is the data model ? What is the relation between Time Period and Date fields ?
- Mark as New
- Bookmark
- Subscribe
- Mute
- Subscribe to RSS Feed
- Permalink
- Report Inappropriate Content
The If()-function has a proper expression defined for when you only have one Region and one [Time Period] possible. But you don't describe what you want to do if there are several possible. What do you want to use as reference line then?
I suggest you use sum({<Category={Budget}>}Value) all the time. Skip the If()-function.
HIC
- Mark as New
- Bookmark
- Subscribe
- Mute
- Subscribe to RSS Feed
- Permalink
- Report Inappropriate Content
The time period is our fiscal quarters throughout the year. The date field is weekly data that we will be using to populate the model. So there will be multiple dates that fit into a time period. Once I load the real data in I will have historical and current data for 3+ yrs so I want to be able to reference what the target budget was for a given time period and see the model adjust depending upon if the date selected falls within a given time period. I hope that clarifies, and thanks for taking a look at this.
- Mark as New
- Bookmark
- Subscribe
- Mute
- Subscribe to RSS Feed
- Permalink
- Report Inappropriate Content
Good point, so what I would like to do is if more than one region is selected, (example AMS, APJ, & EMEA) I would like to make the reference line reflect the selection so it would be the budget for those three regions if they are selected together. (Budget AMS+Budget APJ, etc).
The other key functionality I am trying to achieve is if I select a date in Q2, (see far left in picture) I want the reference lines to update to the Q2 number automatically without the user having to specifically select the time period. In other words, the date selection will drive what reference line is shown by looking up the time period which it falls under, and then if the user selects multiple regions for that date, the reference line then provides the correctly totalled sum.